Highlights of the Philippine Export and Import Statistics March 2024 (Preliminary)

A. TOTAL EXTERNAL TRADE AND BALANCE OF TRADE
1. Total external trade decreased by 15.4 percent
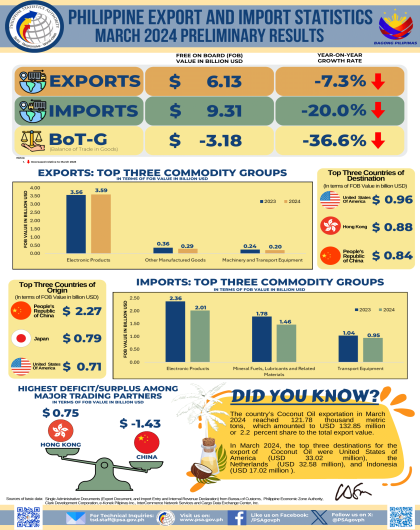
In March 2024, the country’s total external trade in goods amounted to USD 15.44 billion, which indicates an annual decrease of 15.4 percent from the USD 18.25 billion total external trade in the same period of the previous year. In February 2024, total external trade in goods registered annual increase of 9.9 percent, while an annual decline of 4.3 percent was registered in March 2023. (Figure 1, and Tables A and 1)
Of the total external trade in March 2024, 60.3 percent were imported goods, while the remaining were exported goods.
2. Trade deficit posted an annual decrease
The balance of trade in goods (BoT-G) is the difference between the value of exports and imports. The BoT-G in March 2024 amounted to USD -3.18 billion, indicating a trade deficit with an annual decrease of 36.6 percent. In February 2024, the trade deficit recorded an annual decline of 5.6 percent, while an annual increase of 12.4 percent was posted in March 2023. (Figure 1, and Tables A and 4)

B. EXPORTS
1. Sales from export posted a negative growth
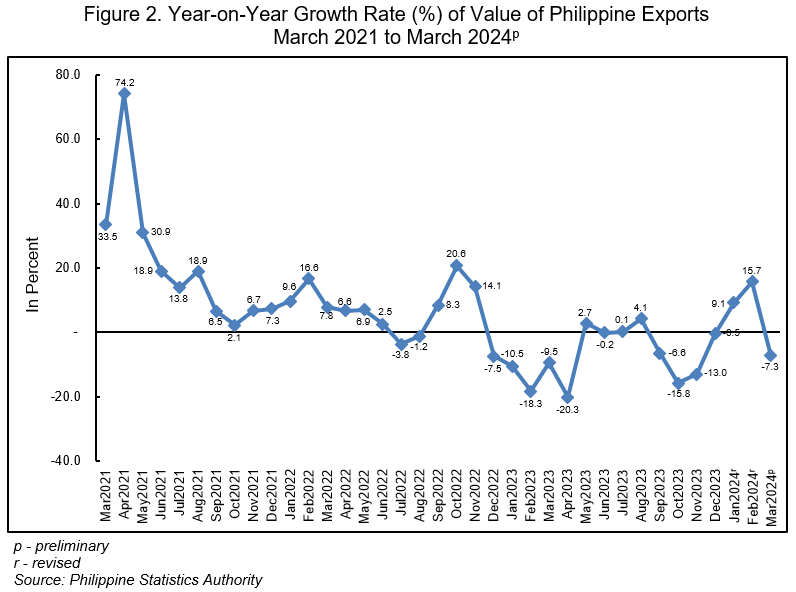
The country’s total export sales in March 2024 amounted to USD 6.13 billion, indicating an annual decrease of 7.3 percent from the USD 6.61 billion total exports in the same month of the previous year. In February 2024, the total exports recorded an annual increase of 15.7 percent, while it posted an annual decline of 9.5 percent in March 2023. (Figures 1 and 2, and Tables A and 3)
The commodity group with the highest annual decrement in the value of exports in March 2024 was other mineral products with USD 195.08 million. This was followed by other manufactured goods with an annual decrease of USD 66.48 million, and cathodes and sections of cathodes, of refined copper with an annual decline of USD 56.05 million. (Tables B and 5)

2. Year-to-date annual total exports increased
The year-to-date annual total value of exports, that is from January to March 2024, amounted to USD 17.98 billion. This represents an annual increase of 4.8 percent from the year-to-date annual total export value of USD 17.16 billion in January to March 2023. (Tables 3 and 6)
3. Electronic products commodity group remained the highest on export sales
By commodity group, electronic products continued to be the country’s top exports in March 2024 with total earnings of USD 3.59 billion or 58.6 percent of the country’s total exports during the period. This was followed by other manufactured goods with an export value of USD 294.13 million (4.8%), and machinery and transport equipment with USD 204.40 million (3.3%). (Figure 3 and Table 5)

4. Manufactured goods still comprised the largest portion of total exports among major types of goods
By major type of goods, exports of manufactured goods contributed the largest to the country’s total exports in March 2024 amounting to USD 4.97 billion or a share of 81.0 percent. This was followed by mineral products with a share of USD 567.35 million (9.3%), and total agro-based products, which contributed USD 463.70 million (7.6%). (Figure 4 and Table 7)

5. United States of America (USA) contributed the highest to the total export value
By major trading partner, exports to USA comprised the highest export value amounting to USD 961.94 million or a share of 15.7 percent to the country’s total exports in March 2024.
Completing the top five major export trading partners for this month with their export values and percent shares to the total exports were:
a. Hong Kong, USD 880.88 million (14.4%);
b. People’s Republic of China, USD 837.51 million (13.7%);
c. Japan, USD 790.02 million (12.9%); and
d. Republic of Korea, USD 391.59 million (6.4%). (Figure 5 and Table 9)

6. Majority of exports were for Asia-Pacific Economic Cooperation (APEC) countries
By economic bloc, majority of the country’s merchandise exports in March 2024 went to APEC countries with a share of USD 5.12 billion or 83.5 percent of the country’s total exports. This was followed by East Asia at USD 3.14 billion (51.2%), and Regional Comprehensive Economic Partnership (RCEP), valued at USD 2.93 billion (47.9%). (Figure 6, and Tables 10 and 18)

7. East Asia contributed the highest export value by geographic region
By geographic region, East Asia comprised the highest export value in March 2024 amounting to USD 3.14 billion (51.2%). This was followed by Northern America with an export value of USD 998.27 million (16.3%), and Southeast Asia with USD 869.90 million (14.2%) worth of exports. (Figure 7 and Table 19)

C. IMPORTS
1. Import value decreased in March 2024
The total imported goods in March 2024 amounted to USD 9.31 billion, indicating an annual decrease of 20.0 percent from the USD 11.63 billion import value in the same month of the previous year. In February 2024, import value recorded an annual increase of 6.5 percent, while in March 2023, it exhibited an annual decline of 1.2 percent. (Figures 1 and 8, and Tables A and 2)

In March 2024, the commodity group with the highest annual decrement in the value of imported goods was electronic products with USD 350.61 million. This was followed by mineral fuels, lubricants and related materials, which declined by USD 323.56 million, and metalliferous ores and metal scrap with an annual decrease of USD 287.48 million. (Tables C and 11)

2. Year-to-date annual total import value decreased
The year-to-date annual total import value, that is from January to March 2024, amounted to USD 29.22 billion. This represents an annual decrement of 7.6 percent from the year-to-date annual total import value of USD 31.61 billion in January to March 2023. (Tables 2 and 12)
3. Electronic products recorded the highest import value among commodity groups
The commodity group with the highest import value in March 2024 was electronic products, which amounted to USD 2.01 billion or a share of 21.6 percent to the country’s total imports. This was followed by mineral fuels, lubricants and related materials at USD 1.46 billion (15.7%), and transport equipment at USD 946.27 million (10.2%). (Figure 9 and Table 11)

4. Imports of raw materials and intermediate goods contributed the highest among major types of goods
By major type of goods, imports of raw materials and intermediate goods accounted for the largest share of the country’s total imports in March 2024, amounting to USD 3.18 billion (34.2%). This was followed by capital goods with a share of USD 2.81 billion (30.2%), and consumer goods with an import value of USD 1.83 billion (19.6%). (Figure 10 and Table 13)

5. People’s Republic of China had the highest import value
People’s Republic of China was the country’s largest supplier of imported goods valued at USD 2.27 billion or 24.4 percent of the country’s total imports in March 2024.
Completing the top five major import trading partners for this month with their corresponding import values and percent shares to the total imports were:
a. Japan, USD 794.02 million (8.5%);
b. USA, USD 705.85 million (7.6%);
c. Republic of Korea, USD 698.79 million (7.5%); and
d. Indonesia, USD 665.49 million (7.1%). (Figure 11 and Table 15)

6. Imports came largely from APEC member countries
By economic bloc, APEC countries were the largest suppliers of the country’s imported goods in March 2024 with a share of USD 7.81 billion (83.9%). This was followed by RCEP with an import value of USD 6.63 billion (71.2%), and East Asia with USD 4.18 billion (44.9%). (Figure 12, and Tables 16 and 18)

7. East Asia contributed the highest import value among geographic regions
By geographic region, East Asia had the highest import value of USD 4.18 billion (44.9%) in March 2024. This was followed by Southeast Asia with an import value amounting to USD 2.65 billion (28.5%), and Northern America valued at USD 766.72 million (8.2%). (Figure 13 and Table 19)

CLAIRE DENNIS S. MAPA, PhD
Undersecretary
National Statistician and Civil Registrar General
See more at the Export and Import Statistics landing page.