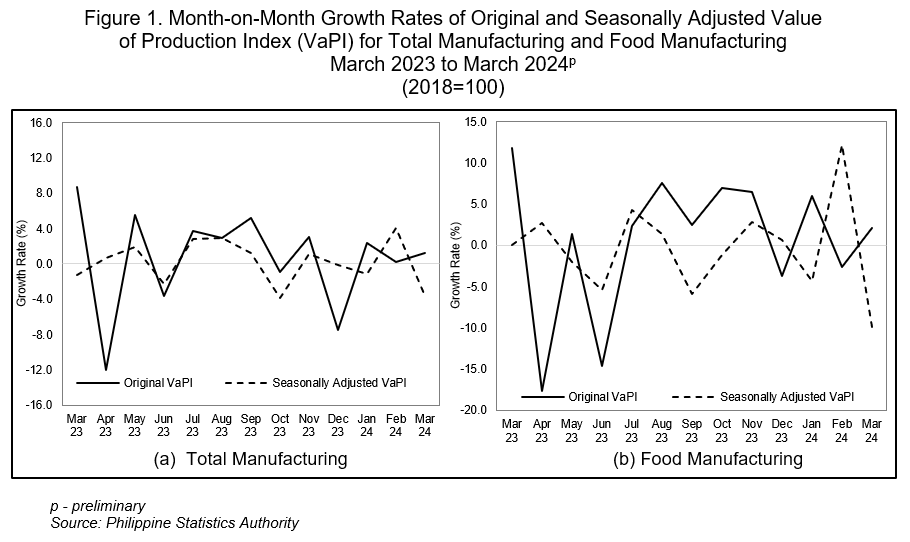
1. Value of Production Index (VaPI)
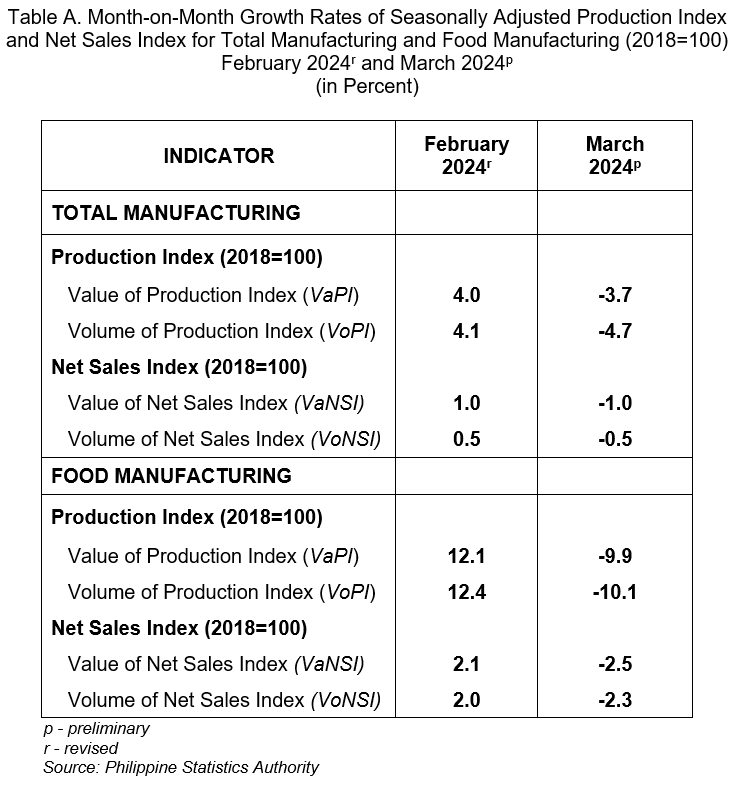
The seasonally adjusted VaPI for total manufacturing declined in March 2024 at a monthly rate of 3.7 percent from the 4.0 percent monthly growth rate observed in February 2024. (Figure 1a, and Tables A and 1)
Likewise, the seasonally adjusted VaPI for food manufacturing contracted by 9.9 percent month-on-month in March 2024. In the previous month, VaPI for for manufacturing increased monthly by 12.1 percent. (Figure 1b, and Tables A and 1)
The seasonally adjusted VaPI of other industry divisions and their month-on-month growths are shown in Table 1a.
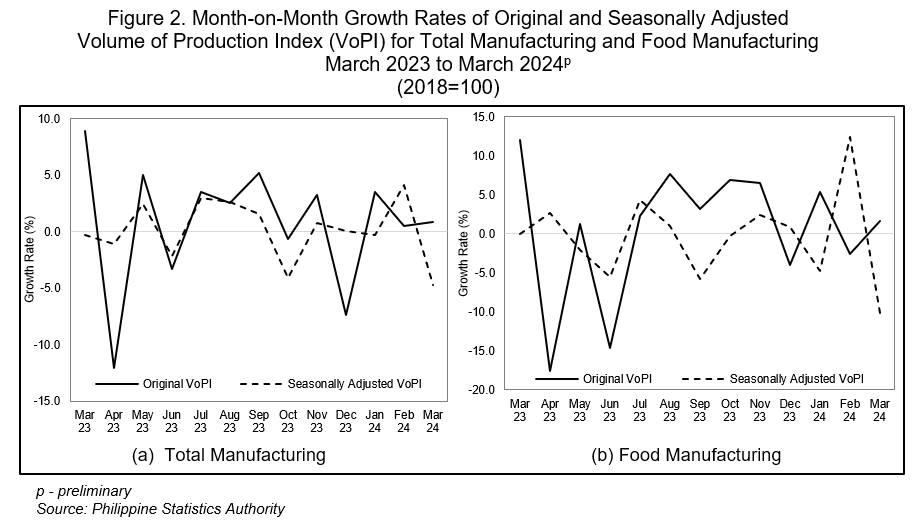
2. Volume of Production Index (VoPI)
The monthly rate of the seasonally adjusted VoPI for total manufacturing decreased by 4.7 percent in March 2024. In February 2024, a 4.1 percent month-on-month growth rate was observed. (Figure 2a, and Tables A and 2)
Similarly, the monthly rate of the seasonally adjusted VoPI for food manufacturing contracted by 10.1 percent during the period from its monthly expansion of 12.4 percent in February 2024. (Figure 2b, and Tables A and 2)
The seasonally adjusted VoPI of other industry divisions are shown in Table 2a.
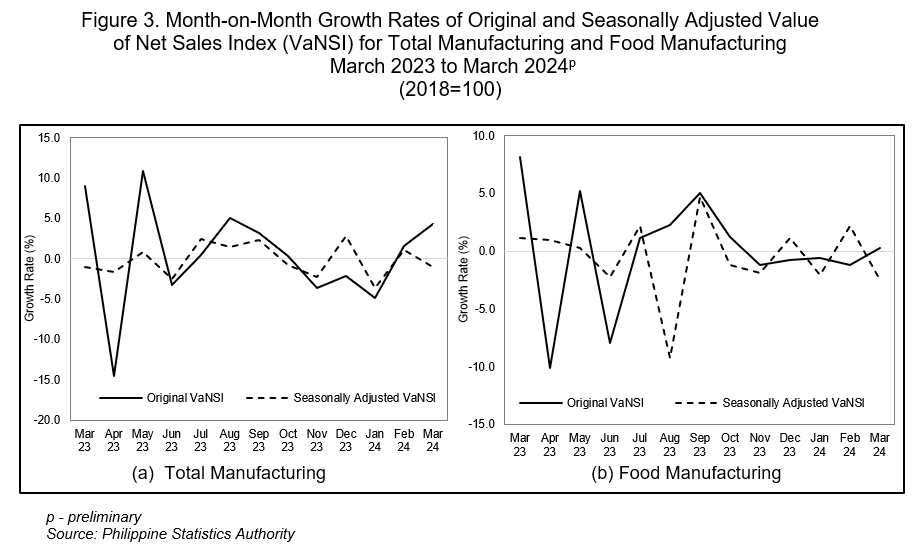
3. Value of Net Sales Index (VaNSI)
In March 2024, the monthly growth rate of the seasonally adjusted VaNSI for total manufacturing declined by 1.0 percent from the 1.0 percent growth in February 2024. (Figure 3a, and Tables A and 3)
Likewise, the seasonally adjusted VaNSI for food manufacturing declined month-on-month by 2.5 percent during the month. In the previous month, an expansion of 2.1 percent monthly was recorded. (Figure 3b, and Tables A and 3)
The seasonally adjusted VaNSI of other industry divisions are shown in Table 3a.
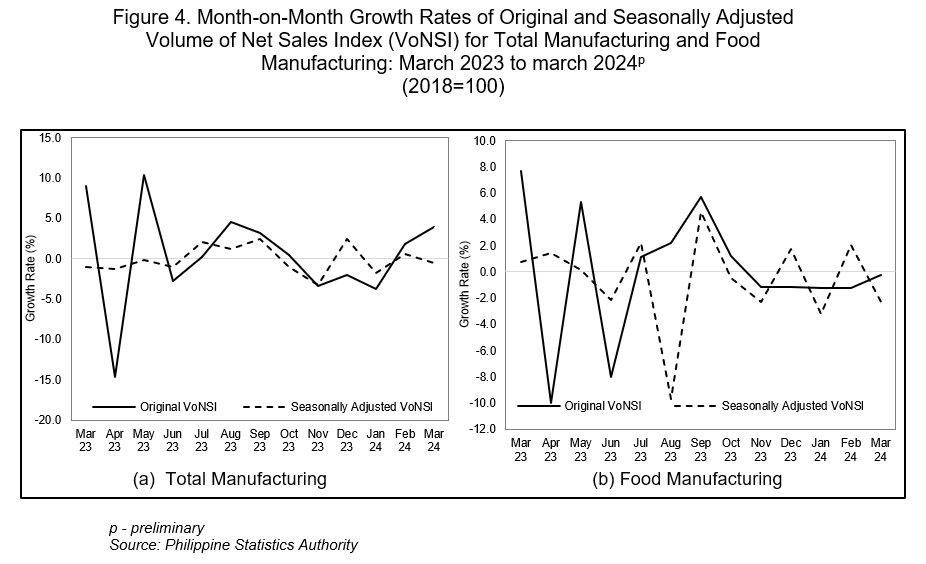
4. Volume of Net Sales Index (VoNSI)
Month-on-month, the seasonally adjusted VoNSI for total manufacturing had a decrease of 0.5 percent in March 2024 from a 0.5 percent monthly growth observed in February 2024. (Figure 4a, and Tables A and 4)
Similarly, the monthly rate of the seasonally adjusted VoNSI for food manufacturing declined by 2.3 percent in March 2024. In February 2024, an expansion of 2.0 percent month-on-month was registered. (Figure 4b, and Tables A and 4)
The seasonally adjusted VoNSI of other industry divisions are shown in Table 4a.
CLAIRE DENNIS S. MAPA, PhD
Undersecretary
National Statistician and Civil Registrar General
See more at the Seasonally Adjusted Production Index and Net Sales Index (Monthly Integrated Survey of Selected Industries) landing page.
Technical Notes
The Monthly Integrated Survey of Selected Industries (MISSI) generates the original series of the Value of Production Index (VaPI), Volume of Production Index (VoPI), Value of Net Sales Index (VaNSI), and Volume of Net Sales Index (VoNSI). These indices provide information on the performance of growth-oriented industries in the manufacturing sector.
This special release features the seasonally adjusted VaPI, VoPI, VaNSI, and VoNSI using X-13 Auto-Regressive Integrated Moving Average (ARIMA) of JDemetra+. The seasonally adjusted series show the trend of value and volume of production and net sales of the manufacturing sector without the effects of seasonal factors.
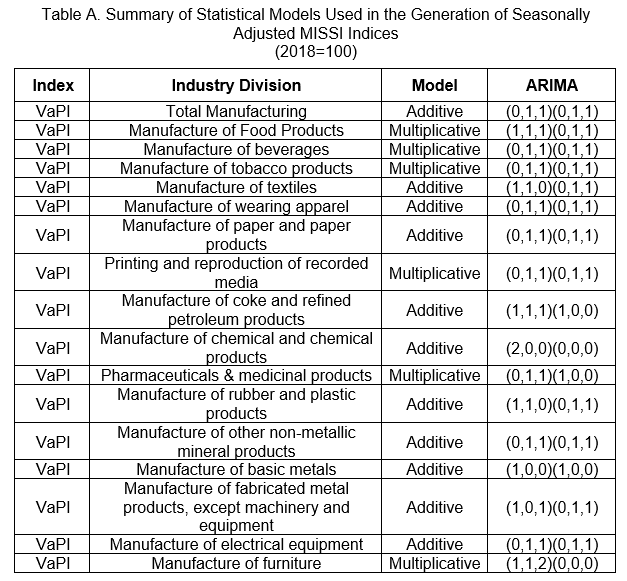
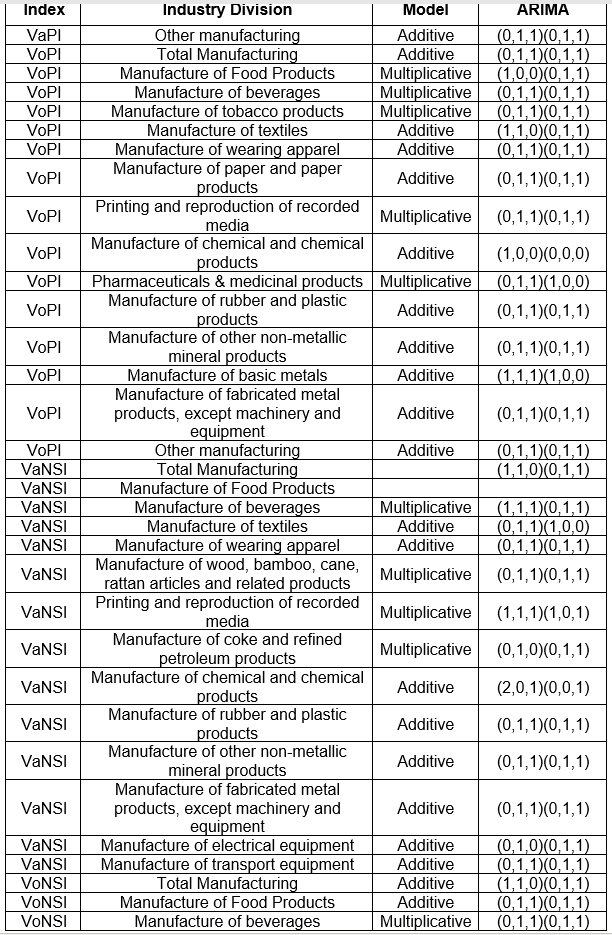
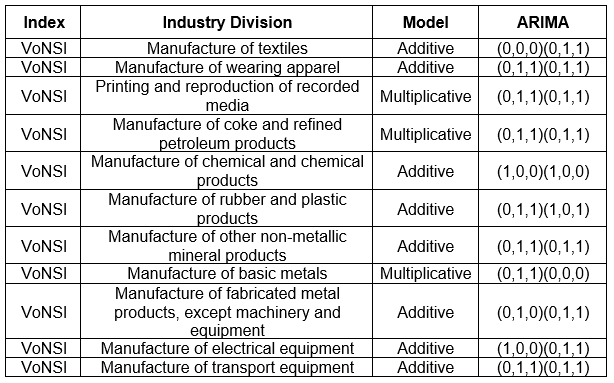
The decomposition model chosen for the seasonal adjustment for each index is shown below.