EXTERNAL TRADE PERFORMANCE
JULY 2013
(Preliminary
p-preliminary
r-revised

JULY 2013 TOTAL TRADE STAND AT $10.322 BILLION
Total external trade in goods for July 2013 reached $10.322 billion, representing a 5.6 percent improvement from $9.775 billion recorded during the same month in 2012. This was due to the 8.7 percent and 2.3 percent growth on total imports and exports, respectively. Thus, the balance of trade in goods (BOT-G) for the Philippines in July 2013 registered a deficit of $649 million from $320 million deficit in the same period last year.

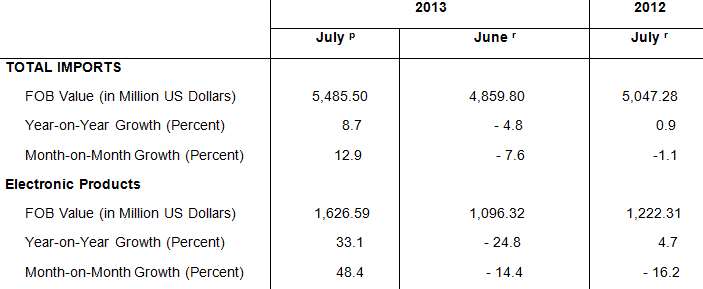
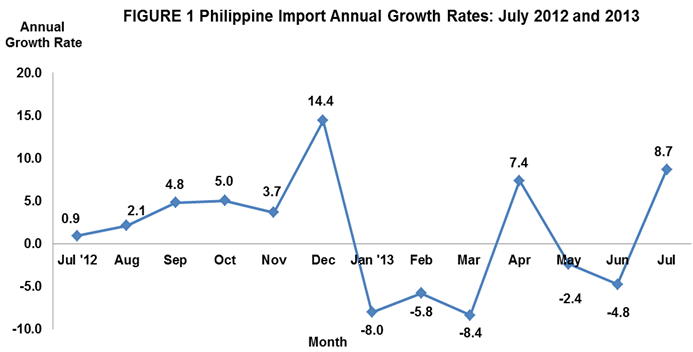
JULY 2013 IMPORTS UP BY 8.7 PERCENT
The country’s total merchandise imports for this month went up by 8.7 percent to $5.486 billion in July 2013 from $5.047 billion in July 2012. Similarly, it increased by 12.9 percent compared to previous month’s level of $4.860 billion. The positive growth was brought about by six out of 10 major commodity groups with positive year-on-year change. These were as follows: iron and steel; electronic products; transport equipment; other food and live animals; telecommunication equipment and electrical machinery; and plastics in primary and non-primary forms. On the other hand, aggregate imports for the first seven months of 2013 amounting to $35.101 billion showed a 2.0 percent decline compared with $35.833 billion in the same seven months of last year.
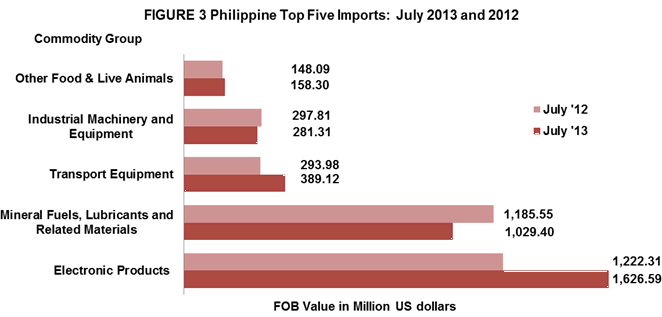
ELECTRONIC PRODUCTS ACCOUNT FOR 29.7 PERCENT OF IMPORT BILL
Accounting for 29.7 percent of the aggregate import bill, Electronic Products was the top imported commodity in July 2013 with payments amounting to $1.627 billion. It grew by 33.1 percent over last year's figure of $1.222 billion. On a monthly basis, it rose by 48.4 percent from $1.096 billion recorded in June 2013. Volume of shipment of this product slightly went down by 0.2 percent compared to July 2012 and went up 4.5 percent compared to June 2013. Among the major groups of electronic products, Components/Devices (Semiconductors), having the biggest share of 24.4 percent, increased by 48.4 percent to $1.339 billion in July 2013 compared with $902.53 million in July 2012.
Imports of Mineral Fuels, Lubricants and Related Materials ranked second with 18.8 percent share and reported value of $1.029 billion in July 2013 compared with $1.186 million in July 2012. Shipment of this product in terms of volume fell by 14.4 percent compared to its recorded volume in July 2012.
Transport Equipment was the PH’s third top import for the month with 7.1 percent share to total imports valued at $389.12 million in July 2013. This figure was 32.4 percent higher than the previous year’s level of $293.98 million. However, compared to previous month, import dropped by 8.2 percent from $423.97 million in June 2013. Volume of this product compared with previous year recorded volume decline by 22.9 percent.
Industrial Machinery and Equipment, contributing 5.1 percent to the total import bill was the PH’s fourth top import for the month amounting to $281.31 million. It dropped by 5.5 percent compared to last year’s value of $297.81 million. Likewise, the volume of shipment of this product decelerated by 3.7 percent compared with same period last year.
Fifth in rank and with 2.9 percent share to the total imports, Other Food and Live Animals recorded $158.30 million worth of imports, higher by 6.9 percent from its year ago level of $148.09 million. Inward shipments in terms of gross kilos registered a positive year-on-year change of 11.7 percent.
Rounding up the list of the top ten imports for July 2013 were Iron and Steel valued at $135.62 million and registering the highest year-on-year change of 36.6 percent among the top ten imports; Plastics in Primary and Non-Primary Forms amounting to $135.47 million; Organic and Inorganic Chemicals, $120.56 million; Cereals and Cereal Preparations, $115.01 million; and Telecommunication Equipment and Electrical Machinery, $111.73 million.
Aggregate payment for the country’s top ten imports for July 2013 reached $4.103 billion or 74.8 percent of the total import bill.
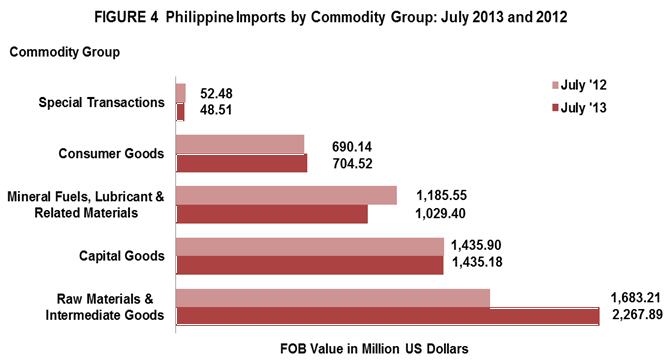
RAW MATERIALS AND INTERMEDIATE GOODS ACCOUNT FOR 41.3 PERCENT OF THE TOTAL IMPORTS
Accounting for 41.3 percent of the total imports, payments in July 2013 for Raw Materials and Intermediate Goods amounted to $2.268 billion or a 34.7 percent increment over last year's figure of $1.683 billion. Compared with previous month’s level, purchases also went up by 33.1 percent from $1.704 billion. Semi-Processed Raw Materials had the biggest share of 37.2 percent and valued at $2.041 billion. However, volume of inward shipments of raw materials and intermediate goods slow down by 3.4 percent compared with the same month a year ago.
Total imports of Capital Goods, comprising 26.2 percent of the total imports, slightly went down by 0.1 percent from $1.436 billion in July 2012 to $1.435 billion in July 2013. Likewise, volume of inward shipments for this product was down by 11.8 percent compared to same month a year ago.
Mineral Fuels, Lubricants and Related Materials with 18.8 percent share to total imports contracted by 13.2 percent from $1.186 billion in July 2012 to $1.029 billion in July 2013. Likewise, volume of shipment of this product shrank by 14.4 percent.
Purchases of Consumer Goods registered a 2.1 percent increase to $704.52 million in July 2013 from $690.14 million in July 2012. Special Transactions went down by 7.6 percent from $52.48 million to $48.51 million in July 2013. Moreover, in terms of volume of shipments, imports of consumer goods and special transactions recorded a negative growth of 25.0 percent and 5.5 percent respectively, compared with volume of shipments in same month last year.
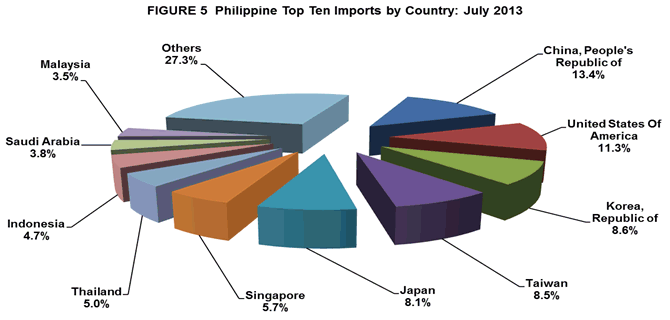
IMPORTS FROM PEOPLE’S REPUBLIC OF CHINA ACCOUNT FOR 13.4 PERCENT
People’s Republic of China was the country’s biggest source of imports for July 2013 with 13.4 percent share of the total import bill, higher by 36.6 percent to $737.14 million from $539.75 million in July 2012. The increase was attributed to the purchases of iron and steel, mineral fuels, lubricants and related materials and industrial machinery and equipment. Exports to China amounted to $640.40 million, yielding a two-way trade value of $1.378 billion and a trade deficit for PH of $96.74 million.
United States of America (USA) including Alaska and Hawaii was the second biggest source of imports with 11.3 percent share. Payments were recorded at $618.07 million, an increase of 23.3 percent from $501.26 million in July 2012. Commodities imported from USA were mostly components/devices (semiconductors) and cereals and cereal preparations. Revenue from PH’s exports to USA, on the other hand, reached $610.84 million, generating a total trade value of $1.229 billion and $7.23 million trade deficit for the Philippines.
Republic of Korea came third, accounting about 8.6 percent share of the total import bill in July 2013 with a positive growth of 12.3 percent to $470.70 million from $419.26 million. Mineral fuels, lubricants and related materials and components/devices (semiconductors) were the recorded imported goods from Korea. Exports to Korea amounted to $181.68 million resulting to a total trade value of $652.38 billion and a trade deficit of $289.03 million.
Taiwan settled fourth accounting for 8.5 percent share of the total import bill in July 2013 or an increase of 41.4 percent to $463.79 million in July 2013 from $328.09 million in July 2012. Commodities purchased from Taiwan in July 2013 were components/devices (semiconductors), mineral fuels, lubricants and related materials and iron and steel. Exports to Taiwan amounted to $153.45 million resulting to a total trade value of $617.24 million and a trade deficit of $310.34 million.
Fifth in rank was Japan including Okinawa, representing a 8.1 percent of the total import bill in July 2013 amounting to $443.92 million. Components /devices (semiconductors) and transport equipment were the imported goods from Japan. Meanwhile, export receipts from Japan in July 2013 reached $956.44 million yielding a total trade value of $1.400 billion and a trade surplus of $512.52 million.
Other major sources of imports for the month of July 2013 were Singapore, $315.10 million; Thailand $276.65 million; Indonesia, $259.45 million; Saudi Arabia, $211.03 million; and Malaysia, $192.83 million.
Payments for imports from the top ten sources for July 2013 amounted to $3.989 billion or 72.7 percent of the total.
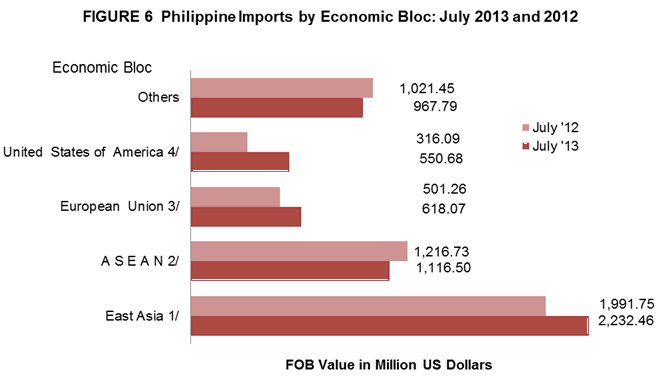
IMPORTS FROM EAST ASIA WORTH $2.232 BILLION
Philippines’ total imports in July 2013 from East Asia (China, Hong Kong, Japan, Macau, Mongolia, North Korea, South Korea and Taiwan) accounted for 40.7 percent of the county’s total imports with total payments of $2.232 billion, higher by 12.1 percent from $1.992 billion in July 2012. Total exports to member-countries of East Asia were valued at $2.347 billion resulting to a total trade of $4.579 billion and a balance of trade in goods (BOT-G) surplus of $114.24 million.
July 2013 imports from ASEAN member-countries registered at $1.117 billion, contributed 20.4 percent share, lower by 8.2 percent from $1.217 billion registered in July 2012. ASEAN member-countries export was worth $768.36 million, resulting to a total trade of $1.885 billion and a trade deficit of $348.14 million.
Imports from European Union were valued at $550.68 million. It expanded by 74.2 percent compared to a year ago recorded value of $316.09 million while exports to member-countries of European Union were worth $532.99 million. This aggregated to total trade of $1.084 billion and a trade deficit of $17.69 million.
Notes:
1/ - includes China, Hong Kong, Japan, Macau, Mongolia, N, Korea, S. Korea, Taiwan
2/ - includes Brunei Darussalam, Cambodia, Indonesia, Laos, Malaysia, Myanmar, Singapore, Thailand, Vietnam
3/ - includes Austria, Belgium, Bulgaria, Cyprus, Czech Republic, Denmark, Estonia, Finland, France, Germany,
Greece, Hungary, Ireland, Italy, Latvia, Lithuania, Luxembourg, Malta, Netherlands, Poland, Portugal, Romania,
Slovakia, Slovenia, Spain, Sweden and UK Great Britain
4/ - includes Alaska and Hawaii
Technical Notes:
1. Adjustments on electronic import statistics are based on the transactions that pass through the Electronic to Mobile (e2m) of the Bureau of Customs (BOC).
2. Starting with the 2007 Press Release, analysis and tables are based on the 2004 Philippine Standard Commodity Classification (PSCC) groupings. This is in compliance with NSCB Resolution No. 03, Series of 2005 entitled “Approving and Adopting the 2004 Philippine Standard Commodity Classification” by all concerned government agencies and instrumentalities.
CARMELITA N. ERICTA
Administrator
Source: Foreign Trade Statistics Section
Industry and Trade Statistics Department
National Statistics Office
Manila