
|
Total manufacturing |
April 2003 |
March 2003 |
|
Year-on-Year Growth |
|
|
|
Production Index |
|
|
|
Value(VaPI) |
9.0 |
17.4r |
|
Volume(VoPI) |
2.0 |
6.4r |
|
Net Sales Index |
|
|
|
Value |
5.0 |
28.0r |
|
Volume |
-4.2 |
13.3r |
|
Producer's Price Index |
6.9 |
10.3r |
|
Average Capacity Utilization |
77.5 |
80.0r |
r -revised
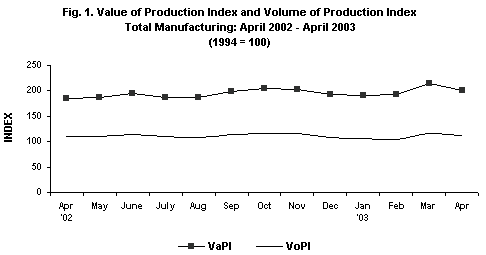
· Value of Production Index (VaPI) expands
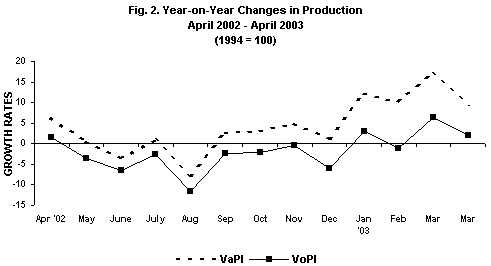
Value of Production Index (VaPI) of the manufacturing industry exhibited a 9.0 percent growth in April 2003 compared with year-ago figure, according to the preliminary results of the Monthly Integrated Survey of Selected Industries (MISSI). Significant increases were observed in the following sectors: wood and wood products, basic metals, leather products, petroleum products, footwear and wearing apparel, miscellaneous manufactures, machinery excluding electrical, rubber products, chemical products and paper and paper products(see Table 1-A).
Compared to the previous month, however, VaPI reported a slump of 6.7 percent in April 2003. The following sectors that contributed to the decline were: transport equipment, furniture and fixtures, tobacco, food manufacturing, textile, fabricated metal products and electrical machinery (see Table 1-A).
· Volume of Production Index (VoPI) registers slight gain
Volume of Production Index (VoPI) in April 2003 posted a 2.0 percent growth on a year-on-year basis. The modest increase in production could be attributed to wood and wood productswhich expanded by 111.3 percent, followed by other sectors which also posted double-digit increases, namely: basic metals, leather products, machinery excluding electrical, miscellaneous manufactures, rubber products and non-metallic mineral products (see Table 1-B).
On the contrary, VoPI fell by 4.6 percent on a month-on-month basis from the previous month's 11.7 percent growth. This was brought about by the sluggish performance of the following sectors:transport equipment, furniture and fixtures, tobacco, textile, food manufacturing andfabricated metal products(see Annex 1-B).
· Value of Net Sales posts lower growth
Value of Net Sales grew at a slower rate of 5.0 percent compared with the previous month's (revised) year-on-year increase of 28.0 percent. Leather products registered the highest growth rate of 86.6 percent followed by other sectors that also posted double-digit increases, namely:machinery excluding electrical, footwear and wearing apparel, petroleum products, publishing and printing, chemical products, rubber products and wood and wood products (see Table 2-A).
However, Value of Net Sales showed a month-on-month downswing of 14.9 percent from a (revised) 19.8 percent increase in March 2003. Sectors attributing to the decline were electrical machinery, basic metals, furniture and fixtures, transport equipment, textile, wood and wood products, paper and paper products, chemical products, food manufacturing andnon-metallic mineral products (see Table 2-A).
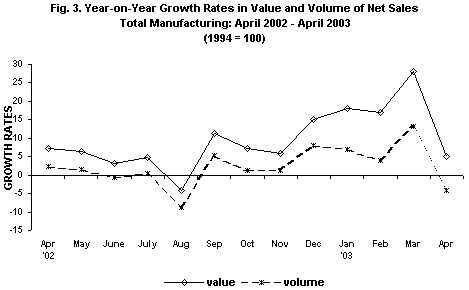
· Net Sales Volume falls
On a year-on-year basis, Volume of Net Sales tumbled by 4.2 percent in April 2003. Sectors that largely contributed to the decline were the following: tobacco, electrical machinery, basic metals, and paper and paper products(see Table 2-B).
On a monthly basis, Net Sales Volume made a turnaround as it went down by 13.3 percent in April 2003 from the previous months (revised) increase of 19.1 percent. Major contributors to the slide were the following sectors: electrical machinery, basic metals, furniture and fixtures, transport equipment, textile, wood and wood products, chemical products, paper and paper products, food manufacturing and non-metallic mineral products (see Table 2-B).
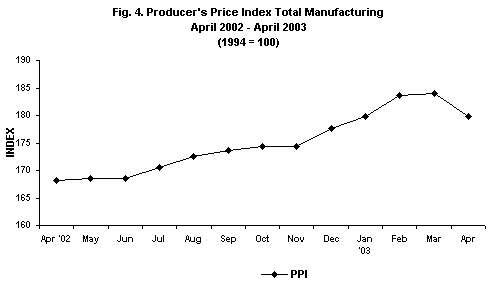
· Producer's Price Index (PPI) continues to accelerate
Producer�s Price Index (PPI) for total manufacturing exhibited a year-on-year growth rate of 6.9 percent in April 2003. Sectors that posted double-digit increases were the following: petroleum products, footwear and wearing apparel, chemical products, paper and paper productsand leather products (see Table 5).
On the other hand, PPI on a month-on-month basis for total manufacturing registered a decline of 2.2 percent in April 2003. The top five sectors which reported decreases in PPI were: electrical machinery, footwear and wearing apparel, paper and paper products, furniture and fixtures and basic metals (see Table 5).
· Capacity Utilization
In April 2003, average capacity utilization for total manufacturing was estimated at 77.5 percent. Sectors that posted more than 80% capacity utilization rate were the following: miscellaneous manufactures, petroleum products, machinery excluding electrical, paper and paper products and footwear and wearing apparel (see Table 6).
The proportion of responding establishments that operated at full capacity (90%-100%) in April 2003 was 19.4 percent. About 42.1 percent of the responding establishments operated at 70%-89% capacity and 38.6 percent of the establishments operated below 70% capacity.
DISTRIBUTION OF KEY MANUFACTURING ESTABLISHMENTS
BY CAPACITY UTILIZATION
TOTAL MANUFACTURING, APRIL 2003
(In percent)
|
Capacity Utilization |
1994-based |
|
Below 50 percent |
13.9 |
|
50 percent - 59 percent |
11.1 |
|
60 percent - 69 percent |
13.6 |
|
70 percent - 79 percent |
20.7 |
|
80 percent - 89 percent |
21.4 |
|
90 percent - 100 percent |
19.4 |
Note: Details may not add up to 100 due to rounding.
· Response Rate
The response rate for April 2003 is 89.7 percent, which corresponds to the retrieval of 499 sample establishments reports (see Table 7).
RESPONSE RATES FOR TOTAL MANUFACTURING
(In percent)
|
April 2003 |
March 2003 |
|
89.7 |
95.9 |
· Technical Notes
Data of non-responding sample establishments are estimated based on previous records and other available sources. Revisions to the preliminary estimates are done upon receipt of actual reports of late respondents.
|
|
(Sgd.) CARMELITA N. ERICTA |
TABLE 1-A. VALUE OF PRODUCTION INDEX, MARCH - APRIL 2003
(1994 =100)
|
Gainers |
Year-on-Year Growth (percent) |
|
|
April 2003 |
March 2003 |
|
|
Petroleum Products |
33.4 |
78.5 |
|
Basic Metals |
56.3 |
106.2 |
|
Chemical Products |
15.8 |
0.6 |
|
Footwear & Wearing Apparel* |
31.0 |
23.1 |
|
Food Manufacturing |
5.6 |
21.4 |
|
Wood & Wood Products |
73.0 |
58.2 |
|
Machinery Excluding Electrical* |
21.4 |
45.4 |
|
Paper and Paper Products |
14.2 |
15.4 |
|
Miscellaneous Manufactures |
22.5 |
23.0 |
|
Textile |
4.9 |
21.6 |
|
Rubber Products |
15.9 |
32.8 |
|
Leather Products* |
52.6 |
-21.4 |
|
Non-Metallic Mineral Products |
2.0 |
-1.0 |
|
Furniture & Fixtures |
4.3 |
15.7 |
|
|
||
|
Losers |
Year-on-Year Growth (percent) |
|
|
April 2003 |
March 2003 |
|
|
Tobacco |
-50.7 |
-41.2 |
|
Electrical Machinery |
-9.9 |
-12.0 |
|
Transport Equipment |
-19.4 |
19.2 |
|
Beverage |
-3.6 |
-1.2 |
|
Fabricated Metal Products* |
-4.6 |
10.2 |
|
Publishing and Printing* |
-1.1 |
11.3 |
TABLE 1-A. VALUE OF PRODUCTION INDEX, MARCH - APRIL 2003(concluded)
(1994=100)
|
Gainers |
Month-on-Month Growth (percent) |
|
|
April 2003 |
March 2003 |
|
|
Footwear & Wearing Apparel* |
7.5 |
-6.9 |
|
Miscellaneous Manufactures |
17.8 |
23.6 |
|
Paper and Paper Products |
3.5 |
10.2 |
|
Petroleum Products |
0.3 |
31.2 |
|
Leather Products* |
24.1 |
30.9 |
|
Basic Metals |
0.5 |
-0.2 |
|
Machinery Excluding Electrical* |
2.0 |
18.1 |
|
Wood & Wood Products |
0.6 |
20.9 |
|
|
||
|
Losers |
Month-on-Month Growth (percent) |
|
|
April 2003 |
March 2003 |
|
|
Food Manufacturing |
-13.8 |
7.2 |
|
Transport Equipment |
-30.6 |
19.3 |
|
Electrical Machinery |
-12.0 |
2.5 |
|
Tobacco |
-19.6 |
3.7 |
|
Chemical Products |
-4.0 |
13.6 |
|
Textile |
-13.1 |
4.7 |
|
Fabricated Metal Products* |
-13.0 |
19.8 |
|
Beverage |
-3.0 |
9.1 |
|
Furniture & Fixtures |
-24.3 |
12.9 |
|
Publishing & Printing* |
-9.7 |
6.4 |
|
Rubber Products |
-8.5 |
3.7 |
|
Non-Metallic Mineral Products |
-0.8 |
8.7 |
Note: * - new sectors in the 1994-based series
Sectors are ranked according to their contribution to the overall 1994-based January 2003 growth rate.
Year-on-year growth rates are computed by dividing the current month index by previous year same month index less 1.
Month-on-month growth rates are computed by dividing the current month index by previous month index less 1.
TABLE 1-B. VOLUME OF PRODUCTION INDEX, MARCH - APRIL 2003
(1994 = 100)
|
Gainers |
Year-on-Year Growth (percent) |
|
|
April 2003 |
March 2003< |
|
|
Basic Metals |
43.5 |
76.3 |
|
Wood and Wood Products |
111.3 |
100.1 |
|
Petroleum Products |
8.3 |
34.2 |
|
Non-Metallic Mineral Products |
12.9 |
10.5 |
|
Footwear and Wearing Apparel* |
9.0 |
2.7 |
|
Machinery Excluding Electrical* |
20.6 |
44.3 |
|
Miscellaneous Manufactures |
16.6 |
15.0 |
|
Rubber products |
15.5 |
32.1 |
|
Leather Products* |
36.2 |
-30.1 |
|
Textile |
1.0 |
22.4 |
|
Paper & Paper Products |
0.3 |
-3.8 |
|
|
||
|
Losers |
Year-on-Year Growth (percent) |
|
|
April 2003 |
March 2003 |
|
|
Tobacco |
-50.7 |
-41.2 |
|
Transport Equipment |
-21.3 |
16.8 |
|
Food Manufacturing |
-2.3 |
10.4 |
|
Beverage |
-6.9 |
-4.7 |
|
Chemical Products |
-2.7 |
-17.1 |
|
Electrical Machinery |
-12.7 |
-18.9 |
|
Fabricated metal Products* |
-5.6 |
9.0 |
|
Publishing & Printing* |
-1.1 |
11.3 |
|
Furniture & Fixtures |
-2.2 |
2.1 |
TABLE 1-B. VOLUME OF PRODUCTION INDEX, MARCH - APRIL 2003
(concluded)
(1994=100)
|
Gainers |
Month-on-Month Growth (percent) |
|
|
April 2003 |
March 20033 |
|
|
Footwear & Wearing Apparel* |
14.3 |
-7.6 |
|
Petroleum Products |
2.8 |
26.1 |
|
Miscellaneous Manufactures |
19.5 |
21.3 |
|
Basic Metals |
3.4 |
-1.6 |
|
Paper & Paper Products |
9.2 |
11.6 |
|
Leather Products* |
24.5 |
30.9 |
|
Machinery Excluding Electrical* |
2.0 |
18.1 |
|
Wood & Wood Products |
1.2 |
21.7 |
|
|
||
|
Losers |
Month-on-Month Growth (percent) |
|
|
April 2003 |
March 2003 |
|
|
Food Manufacturing |
-13.5 |
6.9 |
|
Transport Equipment |
-30.7 |
18.7 |
|
Tobacco |
-19.6 |
3.7 |
|
Textile |
-17.4 |
4.5 |
|
Chemical Products |
-3.7 |
13.1 |
|
Fabricated Metal Products* |
-13.0 |
17.1 |
|
Beverage |
-3.0 |
9.1 |
|
Furniture & Fixtures |
-22.0 |
12.3 |
|
Publishing & Printing* |
-9.7 |
6.4 |
|
Rubber Products |
-8.3 |
3.3 |
|
Non-Metallic Mineral Products |
-1.1 |
5.5 |
|
Electrical Machinery |
-3.0 |
5.8 |
Note: * - new sectors in the 1994-based series
Sectors are ranked according to their contribution to the overall 1994-based January 2003 growth rate.
Year-on-year growth rates are computed by dividing the current month index by previous year same month index less 1.
Month-on-month growth rates are computed by dividing the current month index by previous month index less 1.
TABLE 2-A. VALUE OF NET SALES, MARCH - APRIL 2003
(1994=100)
|
Gainers |
Year-on-Year Growth (percent) |
|
|
April 2003 |
March 2003 |
|
|
Petroleum Products |
34.5 |
70.6 |
|
Food Manufacturing |
9.7 |
22.4 |
|
Chemical Products |
15.2 |
14.9 |
|
Footwear and Wearing Apparel* |
35.2 |
18.7 |
|
Machinery Excluding Electrical* |
42.9 |
68.7 |
|
Publishing and Printing* |
25.2 |
45.0 |
|
Beverage |
3.7 |
8.7 |
|
Wood and Wood Products |
13.1 |
28.3 |
|
Leather Products* |
86.6 |
-25.3 |
|
Rubber Products |
14.0 |
19.0 |
|
Miscellaneous Manufactures |
5.9 |
9.8 |
|
Textile |
1.8 |
24.9 |
|
|
||
|
Losers |
Year-on-Year Growth (percent) |
|
|
April 2003 |
March 2003 |
|
|
Electrical Machinery |
-27.7 |
10.3 |
|
Tobacco |
-37.2 |
-27.8 |
|
Basic Metals |
-17.9 |
93.5 |
|
Transport Equipment |
-12.5 |
11.1 |
|
Paper and Paper Products |
-5.6 |
23.5 |
|
Non-metallic Mineral Products |
-2.1 |
0.8 |
|
Furniture and Fixtures |
-1.9 |
28.3 |
|
Fabricated Metal Products* |
-0.4 |
21.0 |
TABLE 2-A. VALUE OF NET SALES, MARCH - APRIL 2003 (concluded)
(1994=100)
|
Gainers |
Month-on-Month Growth (percent) |
|
|
April 2003 |
March 2003 |
|
|
Footwear and Wearing Apparel* |
15.2 |
-13.8 |
|
Miscellaneous Manufactures |
8.2 |
8.3 |
|
Leather Products* |
38.9 |
25.1 |
|
Rubber Products |
3.6 |
-15.7 |
|
|
||
|
Losers |
Month-on-Month Growth (percent) |
|
|
April 2003 |
March 2003 |
|
|
Electrical Machinery |
-41.7 |
21.9 |
|
Food Manufacturing |
-11.1 |
11.2 |
|
Basic Metals |
-34.7 |
86.2 |
|
Chemical Products |
-14.5 |
16.4 |
|
Transport Equipment |
-22.8 |
13.4 |
|
Petroleum Products |
-4.5 |
25.4 |
|
Textile |
-17.6 |
2.5 |
|
Beverage |
-8.0 |
27.9 |
|
Non-metallic Mineral Products |
-10.3 |
5.9 |
|
Paper and Paper Products |
-16.2 |
16.9 |
|
Tobacco |
-6.2 |
12.8 |
|
Furniture and Fixtures |
-29.5 |
22.0 |
|
Wood and Wood Products |
-17.2 |
16.3 |
|
Fabricated Metal Products* |
-7.9 |
18.2 |
|
Publishing and Printing* |
-7.2 |
18.2 |
|
Machinery Excluding Electrical* |
-2.4 |
18.1 |
Note: * - new sectors in the 1994-based series
Sectors are ranked according to their contribution to the overall 1994-based January 2003 growth rate.
Year-on-year growth rates are computed by dividing the current month value of net sales by previous year same month value of net sales less 1.
Month-on-month growth rates are computed by dividing the current month value of net sales by previous month value of net sales less 1.
TABLE 2-B. VOLUME OF NET SALES, MARCH - APRIL 2003
(1994=100)
|
Gainers |
Year-on-Year Growth (percent) |
|
|
April 2003 |
March 2003 |
|
|
Petroleum Products |
9.2 |
28.3 |
|
Machinery Excluding Electrical* |
41.9 |
67.5 |
|
Footwear and Wearing Apparel* |
12.6 |
-1.0 |
|
Wood and Wood Products |
38.3 |
62.3 |
|
Publishing and Printing* |
25.2 |
45.0 |
|
Non-metallic Mineral Products |
8.3 |
12.5 |
|
Food Manufacturing |
1.5 |
11.3 |
|
Rubber Products |
13.7 |
18.4 |
|
Leather Products* |
66.6 |
-33.6 |
|
Miscellaneous Manufactures |
0.8 |
2.7 |
|
Beverage |
0.1 |
27.8 |
|
|
||
|
Losers |
Year-on-Year Growth (percent) |
|
|
April 2003 |
March 2003 |
|
|
Electrical Machinery |
-30.0 |
-1.5 |
|
Basic Metals |
-24.6 |
65.4 |
|
Tobacco |
-37.2 |
-27.8 |
|
Transport Equipment |
-14.5 |
8.8 |
|
Chemical Products |
-3.2 |
-5.3 |
|
Paper and Paper Products |
-17.2 |
2.9 |
|
Textile |
-2.0 |
25.7 |
|
Furniture and Fixtures |
-8.0 |
13.2 |
|
Fabricated Metal Products* |
-1.5 |
19.6 |
TABLE 2-B. VOLUME OF NET SALES, MARCH - APRIL 2003(concluded)
(1994=100)
|
Gainers |
Month-on-Month Growth (percent) |
|
|
April 2003 |
March 2003 |
|
|
Footwear and Wearing Apparel* |
22.4 |
-14.5 |
|
Miscellaneous Manufactures |
9.7 |
6.3 |
|
Leather Products* |
39.4 |
25.1 |
|
Rubber Products |
3.9 |
-16.0 |
|
|
||
|
Losers |
Month-on-Month Growth (percent) |
|
|
April 2003 |
March 2003 |
|
|
Electrical Machinery |
-35.7 |
25.8 |
|
Food Manufacturing |
-10.7 |
10.9 |
|
Basic Metals |
-32.9 |
83.7 |
|
Chemical Products |
-14.2 |
15.9 |
|
Transport Equipment |
-22.9 |
12.9 |
|
Textile |
-21.7 |
2.2 |
|
Beverage |
-8.0 |
27.8 |
|
Non-metallic Mineral Products |
-10.6 |
2.7 |
|
Petroleum Products |
-2.1 |
20.5 |
|
Paper and Paper Products |
-11.6 |
18.3 |
|
Tobacco |
-6.2 |
12.8 |
|
Furniture and Fixtures |
-27.3 |
21.4 |
|
Wood and Wood Products |
-16.7 |
17.0 |
|
Fabricated Metal Products* |
-7.9 |
15.5 |
|
Publishing and Printing* |
-7.2 |
18.2 |
|
Machinery Excluding Electrical* |
-2.4 |
18.1 |
Note: * - new sectors in the 1994-based series
Sectors are ranked according to their contribution to the overall 1994-based January 2003 growth rate.
Year-on-year growth rates are computed by dividing the current month volume of net sales by previous year same month volume of net sales less 1.
Month-on-month growth rates are computed by dividing the current month volume of net sales by previous month volume of net sales less 1.
Source: National Statistics Office
Manila, Philippines