Summary Inflation Report Consumer Price Index (2018=100): March 2024
Table A. Year-on-Year Inflation Rates, All Items
In Percent
(2018=100)
|
|
|
|
|
|---|---|---|---|---|
| Philippines | ||||
| Headline | 7.6 | 3.4 | 3.7 | 3.3 |
| Core | 8.0 | 3.6 | 3.4 | 3.6 |
| NCR | ||||
| Headline | 7.8 | 3.2 | 3.3 | 3.1 |
| AONCR | ||||
| Headline | 7.5 | 3.5 | 3.8 | 3.4 |
| Source: Philippine Statistics Authority, Retail Price Survey of Commodities for the Generation of Consumer Price Index *Year-on-year change of CPI for January to March 2024 vs. 2023 | ||||
A. Philippines
1. Headline Inflation
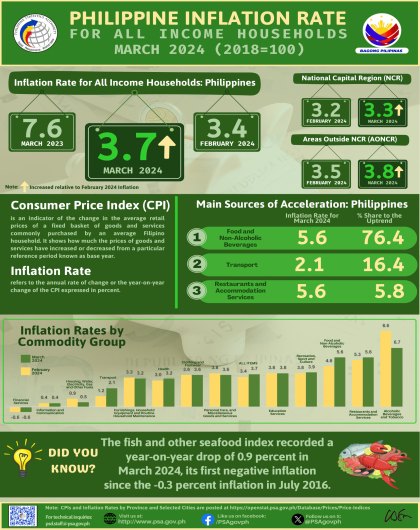
The Philippines’ headline inflation or overall inflation increased to 3.7 percent in March 2024 from 3.4 percent in February 2024. This brings the national average inflation from January to March 2024 at 3.3 percent. In March 2023, inflation rate was higher at 7.6 percent. (Figure 1, and Tables A, B, 5, and 14)
1.1 Main Drivers to the Upward Trend of the Headline Inflation
The uptrend in the overall inflation in March 2024 was primarily influenced by the higher year-on-year increase in the heavily-weighted food and non-alcoholic beverages at 5.6 percent during the month from 4.6 percent in February 2024. In addition, the faster annual increases in the indices of transport at 2.1 percent during the month from 1.2 percent in February 2024, and restaurants and accommodation services at 5.6 percent in March 2024 from 5.3 percent in the previous month contributed to the uptrend.
Moreover, higher inflation rates were also noted in the indices of health at 3.2 percent and recreation, sport and culture at 3.9 percent during the month from their respective inflation rates of 3.0 percent and 3.8 percent in the previous month.
In contrast, the following commodity groups registered lower inflation rates during the month:
a. Alcoholic beverages and tobacco, 6.7 percent from 8.6 percent;
b. Housing, water, electricity, gas and other fuels, 0.5 percent from 0.9 percent;
c. Furnishings, household equipment and routine household maintenance, 3.2 percent from 3.3 percent; and
d. Personal care, and miscellaneous goods and services, 3.6 percent from 3.8 percent.
The indices of the rest of the commodity groups retained their respective previous month’s annual rates. (Tables 5 and 6)
1.2 Main Contributors to the Headline Inflation
The top three commodity groups contributing to the March 2024 overall inflation were the following:
a. Food and non-alcoholic beverages with 57.3 percent share or 2.1 percentage points;
b. Restaurants and accommodation services with 14.6 percent share or 0.5 percentage point; and
c. Transport with 5.1 percent share or 0.2 percentage point.
2. Food Inflation
Food inflation at the national level rose to 5.7 percent in March 2024 from 4.8 percent in February 2024. In March 2023, food inflation was higher at 9.5 percent. (Table 9)
2.1 Main Drivers to the Upward Trend of Food Inflation
The acceleration of food inflation in March 2024 was mainly brought about by the slower year-on-year decrease in vegetables, tubers, plantains, cooking bananas and pulses index at 2.5 percent in March 2024 from 11.0 percent annual decline in the previous month. In addition, meat and other parts of slaughtered land animals index recorded a faster annual increment of 2.0 percent during the month from 0.7 percent in February 2024.
The inflation rate of cereals and cereals products, which includes rice, corn, flour, bread and other bakery products, pasta products, and other cereals, also increased to 17.3 percent during the month from 17.0 percent in February 2024. Moreover, slower annual decline was noted in the index of oils and fats at 4.6 percent during the month from 4.8 percent annual decline in February 2024.
On the contrary, lower annual growth rates during the month were observed in the indices of the following food groups:
a. Milk, other dairy products and eggs, 2.3 percent from 3.5 percent;
b. Fruits and nuts, 7.9 percent from 8.7 percent; and
c. Ready-made food and other food products not elsewhere classified, 4.3 percent from 4.6 percent.
In addition, the index of fish and other seafood recorded an annual decline of 0.9 percent during the month from a 0.7 percent annual increase in the previous month, while faster annual decline of 2.9 percent was observed in sugar, confectionery and desserts index from a 2.4 percent annual decline in February 2024. (Tables 7 and 13)
2.2 Main Contributors to the Food Inflation
Food inflation shared 55.2 percent or 2.0 percentage points to the overall inflation in March 2024. The top three food groups in terms of contribution to the food inflation during the month were the following:
a. Cereals and cereal products, which includes rice, corn, flour, bread and other bakery products, pasta products, and other cereals, with 91.3 percent share or 5.2 percentage points;
b. Meat and other parts of slaughtered land animals with 5.5 percent share or 0.3 percentage point; and
c. Fruits and nuts with 5.1 percent share or 0.3 percentage point.
3. Core Inflation
Core inflation, which excludes selected food and energy items, slowed down to 3.4 percent in March 2024 from 3.6 percent in the previous month. In March 2023, core inflation was higher at 8.0 percent. (Tables A, 11, and 17)
B. National Capital Region (NCR)
Similarly, inflation in NCR moved at a faster pace at 3.3 percent in March 2024 from 3.2 percent in the previous month. In March 2023, inflation rate in the area was recorded at 7.8 percent. (Tables A, 5, and 15)
The main driver to the increase of inflation rate in the area was the higher annual increment in the heavily-weighted food and non-alcoholic beverages at 4.5 percent during the month from 3.3 percent in February 2024. Also contributing to the uptrend of inflation in the area was the faster inflation rate reported in transport at 2.2 percent in March 2024 from 1.3 percent in the previous month.
Moreover, higher year-on-year mark-ups were noted in the indices of the following commodity groups during the month:
a. Clothing and footwear, 2.2 percent from 2.0 percent;
b. Furnishings, household equipment and routine household maintenance, 2.1 percent from 2.0 percent;
c. Information and communication, 0.2 percent from 0.1 percent; and
d. Recreation, sport and culture, 1.6 percent from 1.5 percent.
In contrast, lower annual increments in March 2024 were observed in the indices of alcoholic beverages and tobacco at 5.2 percent from 6.7 percent, and housing, water, electricity, gas and other fuels at 2.4 percent from 3.5 percent.
The indices of the rest of the commodity groups moved at their respective annual rates in February 2024. (Tables 5 and 6)
C. Areas Outside NCR (AONCR)
Following the trend at the national level and in NCR, overall inflation in AONCR also showed an uptrend at 3.8 percent in March 2024 from 3.5 percent in February 2024. In March 2023, inflation in the area was recorded at 7.5 percent. (Tables A, 5, and 16)
The acceleration of inflation in the area was mainly contributed by the higher annual increase in the heavily-weighted food and non-alcoholic beverages at 5.7 percent in March 2024 from 4.9 percent in February 2024. Also contributing to the uptrend of inflation in the area were the faster annual increments in the indices of transport at 2.0 percent during the month from 1.2 percent annual growth in February 2024, and restaurants and accommodation services with 6.2 percent annual increase during the month from 5.8 percent in February 2024.
Furthermore, higher year-on-year increase in March 2024 was also observed in the recreation, sport and culture index at 4.4 percent in March 2024 from 4.3 percent in the previous month.
On the other hand, lower inflation rates were observed in the indices of the following commodity groups during the month:
a. Alcoholic beverages and tobacco, 7.0 percent from 8.9 percent;
b. Furnishings, household equipment and routine household maintenance, 3.6 percent from 3.7 percent; and
c. Personal care, and miscellaneous goods and services, 3.8 percent from 4.0 percent.
In addition, the index of housing, water, electricity, gas and other fuels recorded an annual decline of 0.1 percent during the month from a zero percent annual rate in February 2024.
The indices of the rest of the commodity groups remained at their respective previous month’s annual rates. (Tables 5 and 6)
Relative to their respective February 2024 inflation rates, 11 regions in AONCR exhibited higher inflation rates in March 2024. The Bangsamoro Autonomous Region in Muslim Mindanao remained with the highest inflation rate of 5.0 percent in March 2024 among the regions in AONCR, while Region I (Ilocos Region) still registered the lowest inflation at 2.2 percent. (Table 6)
Note: CPIs and inflation rates by province and selected city are posted at the PSA OpenSTAT portal at https://openstat.psa.gov.ph/PXWeb/pxweb/en/DB/DB__2M__PI__CPI__2018/?tablelist=true.
CLAIRE DENNIS S. MAPA, PhD
Undersecretary
National Statistician and Civil Registrar General
See more at the CPI and Inflation Rate main page.