
Distribution of electricity industry leads in terms of number of establishments
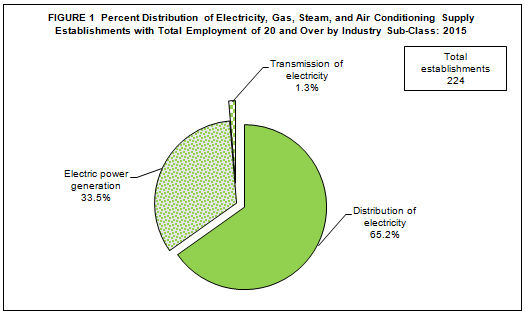
The total number of establishments engaged in electricity, gas, steam and air conditioning supply establishments with total employment (TE) of 20 and over in the formal sector of the economy reached 224, according to the preliminary results of the 2015 Annual Survey of Philippine Business and Industry (ASPBI).
Among the three industries of the sector, distribution of electricity recorded as the highest with 146 establishments or 65.2 percent of the total. Electric power generation followed with 75 establishments or 33.5 percent of the total. Transmission of electricity reported only a total of three (3) establishments or 1.3 percent of the total.
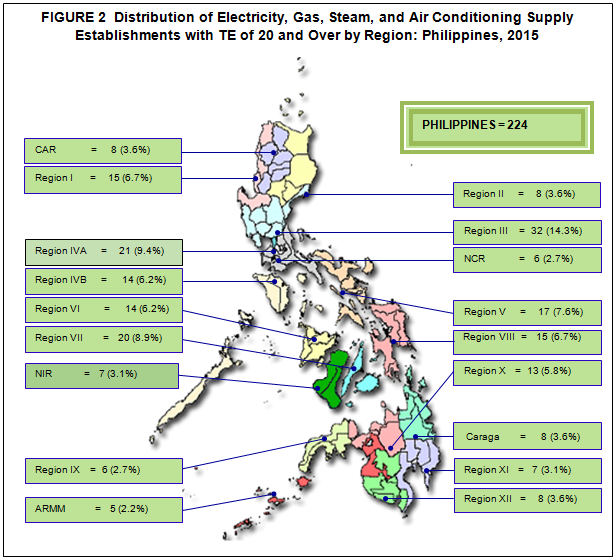
The top three regions, in terms of number of establishments, accounted for almost one-third (32.6%) of the total number of establishments. Central Luzon led the regions with 32 establishments or 14.3 percent of the total. CALABARZON placed second with 21 establishments (9.4%) and Central Visayas with 20 establishments (8.9%). On the other hand, Autonomous Region in Muslim Mindanao (ARMM) recorded the least with 5 establishments or 2.2 percent of the total. Figure 2 shows the regional distribution of all electricity, gas, steam, and air conditioning supply establishments in 2015.
Total employment of the sector reaches 46,335
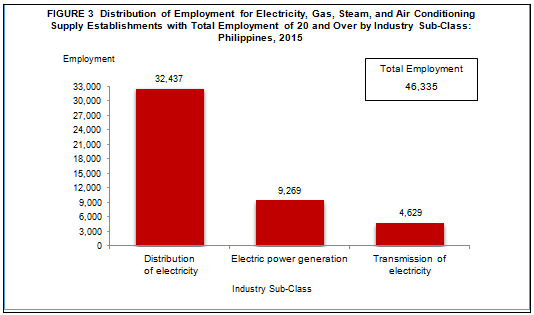
Total employment generated by electricity, gas, steam, and air conditioning supply establishments with TE of 20 and over reached 46,335 in 2015, of which all were paid employees.
At the industry level, distribution of electricity reported the highest number of workers with 32,437 or 70.0 percent of the total. Electric power generation followed next with 9,269 workers (20.0%) and transmission of electricity came as the third top employer with 4,629 workers (10.0%).
The top three regions, in terms of employment generation, were all located in Central Luzon. National Capital Region (NCR), despite being one of the regions with the least number of electricity, gas, steam, and air conditioning supply establishments, employed the most number of workers with 8,494 or 18.3 percent of the total. Central Luzon emerged as second with 5,368 workers (11.6%) and CALABARZON with 4,817 workers (10.4%).
The average number of workers per establishment for the sector was recorded at 207. NCR consistently recorded as the region with the highest average number of employment at 1,416. This was followed by Northern Mindanao and Negros Island Region with 246 and 237 workers per establishment, respectively.
CALABARZON pays the highest average annual compensation
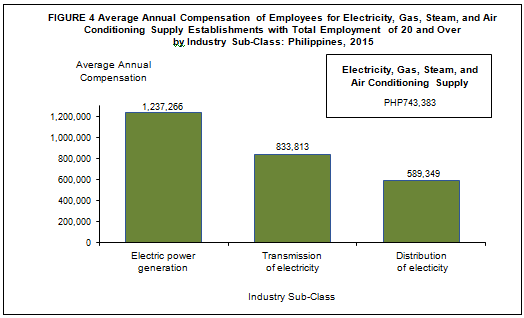
Total compensation paid by the sector which consists of gross salaries and wages, separation and retirement/terminal pay, gratuities, employers’ contribution to SSS/GSIS, and other benefits amounted to PHP34.4 billion for establishments with TE of 20 and over in 2015. This translated to an average annual compensation of PHP743,383 per employee.
Across regions, CALABARZON received the highest average annual pay of PHP1,209,356 in 2015. This was followed by NCR which received an average annual compensation of PHP1,129,857. Eastern Visayas was the third highest paid region earning an annual pay of PHP878,971. ARMM was the least paid region with PH199,822 average annual pay. Figure 2 shows the average annual compensation of employees for electricity, gas, steam and air-conditioning supply establishments by region in 2015.
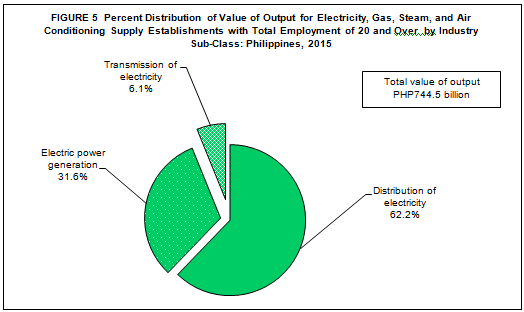
Distribution of electricity industry generates highest value of output
Total value of output generated by the sector for establishments with total employment of 20 and over in 2015 amounted to PHP744.5 billion.
Distribution of electricity generated the highest value of output amounting to PHP463.2 billion (62.2%). Electric power generation reported the second highest value of output of PHP235.6 billion (31.6%). Transmission of electricity followed with total value of output of PHP45.7 billion (6.1%).
Among regions, NCR generated the highest value of output with PHP180.6 billion representing 23.9 percent of the total, followed by CALABARZON with PHP175.4 billion or 23.2 percent. Central Luzon placed third with value of output equivalent to PHP100.6 billion or 13.3 percent. ARMM reported the least amount of value of output at PHP2.7 billion or 0.4 percent of the total. Figure 5 shows the value of output for all electricity, gas, steam and air conditioning supply establishments by region in 2015.
Distribution of electricity industry incurs the highest expense in 2015
Total expense, including compensation, incurred in business operation of electricity, gas, steam, and air conditioning supply establishments with TE of 20 and over in 2015 amounted to PHP649.6 billion.
Distribution of electricity was the highest spender worth PHP427.6 billion (65.8%). Electric power generation followed with PHP198.5 billion (30.6%). Transmission of electricity emerged as the least industry spender with PHP23.4 billion or 3.6 percent of the total.
CALABARZON spent the highest among the regions estimated at PHP160.8 billion (24.8%), followed by NCR spending PHP151.4 billion (23.3%). Central Luzon placed third with PHP85.9 billion (13.2%). ARMM spent the least amount with only PHP2.7 billion (0.4%).
Income per expense ratio for the sector is 1.21
Income per expense ratio for the sector in 2015 for establishments with TE of 20 and over was recorded at 1.21, indicating that for every peso spent PHP1.21 was realized in terms of income.
Transmission of electricity registered the highest return of 1.96 higher than the sectors average. Electric power generation recorded an income per peso expense of 1.39 while distribution of electricity registered at 1.08.
Among regions, establishments in Northern Mindanao registered the highest return at 1.41 income per peso expense. This was followed by Ilocos region and CAR with 1.39 and 1.33 income per peso expense, respectively.
Electric power generation industry reports highest share to value added
Value added, defined as gross output less intermediate input, generated by all electricity, gas, steam and air conditioning supply establishments reached PHP205.9 billion in 2015 for establishments with TE of 20 and over.
Electric power generation reported the highest value added amounting to PHP98.6 billion (47.9%). Distribution of electricity with PHP73.1 billion (35.5%) was the next highest value added contributor. Transmission of electricity placed third with PHP34.2 billion (16.6%).
By region, NCR accounted for the biggest share to total value added amounting to PHP52.7 billion or 25.6 percent of the total. This was followed by CALABARZON and Central Luzon with PHP40.0 billion (19.4%) and PHP27.6 billion (13.4%), respectively.
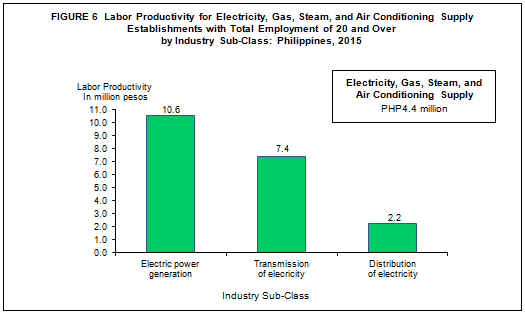
Labor productivity for the sector posts PHP4.4 million per worker
The ratio of value added to total employment, a simple measure of labor productivity, was estimated at PHP4.4 million per worker for establishments with TE of 20 and over.
At the industry level, electric power generation was the most productive with recorded labor productivity of PHP10.6 million per worker. Industries related to transmission and distribution of electricity placed second and third with labor productivity of PHP7.4 and PHP2.2 million per worker, respectively.
By region, CALABARZON emerged as the most productive region recording a labor productivity ratio of PHP8.3 million per worker. This was followed by Western Visayas and NCR with respective labor productivity of PHP6.8 million and PHP6.2 million per worker.
Gross addition to tangible fixed assets amounts to PHP31.4 billion
Gross addition to tangible fixed assets, defined as capital expenditures less sale of fixed assets, was estimated at PHP31.4 billion in 2015 for establishments with TE of 20 and over.
More than 60 percent of the gross addition to tangible fixed assets of the sector was reported by distribution of electricity with PHP19.8 billion. Electric power generation followed with PHP11.6 billion (37.1%).
At the regional level, CALABARZON reported the highest gross addition to fixed assets amounting to PHP6.3 billion (20.0%). NCR came in next with PHP5.1 billion (16.3%).
Total subsidy received by the sector in 2015 reaches PHP10.9 billion
Total subsidy provided by the government to support the business operation of electricity, gas, steam and air conditioning supply establishments was estimated at PHP10.9 billion for establishments with TE of 20 and over in 2015.
Of the three industries included in the sector, only distribution of electricity and electric power generation received subsidies in 2015. Transmission of electricity did not report any subsidy received in 2015.
Among regions, Caraga received the highest subsidy in 2015 estimated at PHP2.6 billion or 23.9 percent of the total. This was followed by NCR and Western Visayas with subsidies amounting to PHP2.0 billion (18.4%) and PHP1.0 billion (9.5%), respectively.
TECHNICAL NOTES
Introduction
This Special Release presents the preliminary results of the 2015 ASPBI for the Electricity, Gas, Steam and Air Conditioning Supply sector for establishments with total employment of 20 and over.
The 2015 ASPBI is one of the designated statistical activities of the Philippine Statistics Authority (PSA). Data collected from the survey provide information on the levels, structure, performance, and trends of economic activities of the formal sector in the entire country for the year 2015. The 2015 Survey on Information and Communication Technology (SICT) was undertaken as a rider to this survey.
The survey was conducted nationwide in 2016 with the year 2015 as the reference period of data, except for employment which is as of November 15, 2015.
Data are presented at the national and industry sub-class or 5-digit 2009 Philippine Standard Industrial Classification (PSIC).
In response to the needs of stakeholders, PSIC D35100 – generation, transmission and distribution of electricity was broken down into detailed sub-class to provide better analysis as follows:
- D35101 Electric power generation
- D35102 Transmission of electricity
- D35103 Distribution of electricity
Data are also generated at the regional level.
Legal Authority
The conduct of the 2015 ASPBI is authorized under Republic Act 10625 known as the Philippine Statistical Act of 2013 - Reorganizing and strengthening of the Philippine Statistical System (PSS), its agencies and instrumentalities.
Scope and Coverage
The 2015 ASPBI covered establishments engaged in 18 economic sectors classified under the 2009 PSIC, namely:
- Agriculture, Forestry and Fishing (A)
- Mining and Quarrying (B)
- Manufacturing (C)
- Electricity, Gas, Steam, and Air Conditioning Supply (D)
- Water Supply; Sewerage, Waste Management and Remediation Activities (E)
- Construction (F)
- Wholesale and Retail Trade; Repair and Maintenance of Motor Vehicles, Motorcycles (G)
- Transportation and Storage (H)
- Accommodation and Food Service Activities (I)
- Information and Communication (J)
- Financial and Insurance Activities (K)
- Real Estate Activities (L)
- Professional, Scientific and Technical Activities (M)
- Administrative and Support Service Activities (N)
- Education (P)
- Human Health and Social Activities (Q)
- Arts, Entertainment and Recreation (R)
- Other Service Activities (S)
The survey was confined to the formal sector of the economy, which consists of the following:
- Corporations and partnership
- Cooperatives and foundations
- Single proprietorship with employment of 10 and over
- Single proprietorships with branches
Hence, the 2015 ASPBI covered only the following economic units:
- All establishments with total employment (TE) of 10 and over, and;
- All establishments with TE of less than 10, except those establishments with Legal Organization = 1 (single proprietorship) and Economic Organization = 1 (single establishment), that are engaged in economic activities classified according to the 2009 Philippine Standard Industrial Classification (PSIC).
Frame of Establishments
The frame for the 2015 ASPBI was extracted from the 2015 List of Establishments (LE). The estimated number of establishments in operation in the country in 2015 totaled to 909,786. About 259,386 establishments (29.0% of the total establishments) belong to the formal sector of which 223,821 (86.3%) comprised the establishment frame. This frame was used to draw the sample establishments for the survey.
Unit of Enumeration
The unit of enumeration for the 2015 ASPBI is the establishment. An establishment is defined as an economic unit under a single ownership or control which engages in one or predominantly one kind of activity at a single fixed location.
Classification of Establishments
An establishment is categorized by its economic organization, legal organization, industrial classification, employment size, and geographic location.
Economic Organization refers to the organizational structure or role of the establishment in the organization. An establishment may be single establishment, branch, establishment and main office with branches elsewhere, main office only, and ancillary unit other than main office.
Legal Organization refers to the legal form of the economic entity which owns the establishment. An establishment may be single proprietorship, partnership, government corporation, stock corporation, non-stock corporation, and cooperative.
Industrial classification of an economic unit was determined by the activity from which it derives its major income or revenue. The 2009 PSIC was utilized to classify economic units according to their economic activities.
Size of an establishment is determined by its total employment (TE) as of specific date.
Geographic Classification refers to the classification by geographic area using the Philippine Standard Geographic Code (PSGC) classification.
Methodology
Sampling Design
The 2015 ASPBI used stratified systematic sampling with five-digit PSIC serving as first stratification variable and TE as the second stratification variable.
For establishments with TE 20 and over, the 18 administrative regions served as the geographic domains while the 5-digit level of the 2009 PSIC served as the industry domains.
To address the data needs of stakeholders for a more detailed industrial classification, D35100 was split and assigned with sub-industry codes as follows:
|
2009 PSIC Code |
Assigned Industry Code |
Description |
|
D35100 |
D35100 |
Generation, transmission and distribution of electricity |
|
|
D35101 |
Electric power generation |
|
|
D35102 |
Transmission of electricity |
|
|
D35103 |
Distribution of electricity |
The newly assigned industry codes will be used to generate data for these sub-industries.
Estimation Procedure for Establishments with TE of 20 and over
- Non-Certainty Stratum (strata of TE 20 to 49 and TE 50 to 99)
Sections A, C, E, F, G, H, I, K, L, M, N, P, Q, R and S
The estimate of the total of a characteristic  for the non-certainty employment strata in an industry domain in each region,
where:
s = denotes the non-certainty employment strata in TE of 20 to 49 and TE 50 to 99
p = 1, 2,..., 17 regions (geographic domains)
xspj = value of the jth establishment in the non-certainty employment strata in TE of 20 and over for an industry domain in each region
j = 1, 2, 3,…, nsp establishments
Wspj = weight of the jth establishment in the non-certainty employment strata in TE of 20 and over for an industry domain in each region

Nsp = total number of establishments in the non-certainty employment strata in TE of 20 and over for an industry domain in each region
nsp = number of sample establishments in the non-certainty employment strata in TE of 20 and over for an industry domain in each region
- Certainty Stratum (TE 100 and over) (Establishments under the following: Section B, D and J, ICT core industries, BPM industries, GOCCs and with TE 100 and over)
The total of a characteristic  for the certainty employment stratum in an industry domain in each region was
where:
c = denotes the certainty employment strata in TE of 20 and over
p = 1, 2,..., 17 regions (geographic domains)
xcpj = value of the jth establishment in the certainty employment strata in TE of 20 and over in an industry domain within each region
j = 1, 2, 3, …, mcp establishments
mcp = number of establishments in the certainty employment strata in TE of 20 and over in an industry domain within each region
- Total Estimate for TE of 20 and Over
The estimate of the total of a characteristic  for the industry domain in each region (geographic domain) was obtained by aggregating the estimates for all employment strata (non-certainty and certainty) in the same industry domain,
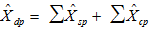
where dp denotes the industry domains in each region.
National level estimates of the characteristics by industry domain were obtained by aggregating separately the estimates  for the particular industry domain from all the regions.
Weight Adjustment Factor for Non-Response
To account for non-response in the non-certainty strata, the adjustment factor (n/n’) was multiplied with the sampling weight (W) of each of the sampling unit. The sampling weight, defined as N/n, was recomputed as
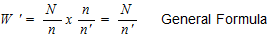
Thus, the adjusted weight (W’spj) for the non-certainty employment stratum for the industry domain with TE 20-99 was
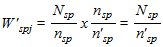
where:
Nsp = total number of establishments in the non-certainty employment stratum with TE 20-99 for the industry domain within each geographic domain (region)
n’sp = number of responding establishments in the non-certainty employment stratum with TE 20-99 for the industry domain within each geographic domain (region)
Response Rate
Response rate for Electricity, Gas, Steam, and Air Conditioning Supply sector for establishments with TE of 20 and over was 90.3 percent (214 out of 237 establishments). This included receipts of "good" questionnaires, partially accomplished questionnaires, reports of closed, moved out or out of scope establishments.
Reports of the remaining non-reporting establishments were imputed based on established imputation methods and from other available administrative data sources and financial statements from Securities and Exchange Commission (SEC). However, reports of establishments which were found to be duplicates and out of business in 2015, were not imputed.
Limitation of Data
Only the formal sector was covered in the survey.
Concepts and Definitions of Terms
Economic activity is the establishment’s source of income. If the establishment is engaged in several activities, its main economic activity is that which earns the biggest income or revenue.
Total employment is the number of persons who worked in for the establishment as of November 15, 2015.
Paid employees are all persons working in the establishment and receiving pay, as well as those working away from the establishment paid by and under the control of the establishment. Included are all employees on sick leave, paid vacation or holiday. Excluded are consultants, home workers, receiving pure commissions only, and workers on indefinite leave.
Compensation is the sum of salaries and wages, separation/retirement/terminal pay, gratuities, and payments made by the employer in behalf of the employees such as contribution to SSS/GSIS, ECC, PhilHealth, Pag-ibig, etc.
Salaries and wages are payments in cash or in kind to all employees, prior to deductions for employee’s contributions to SSS/GSIS, withholding tax, etc. Included are total basic pay, overtime pay and other benefits.
Income or Revenue refers to cash received and receivables for goods/products and by-products sold and services rendered.
E-commerce refers to the selling of products or services over electronic systems such as Internet Protocol-based networks and other computer networks. Electronic Data Interchange (EDI) network, or other on-line system. Excluded are orders received from telephone, facsimile and e-mails.
Expense refers to cost incurred in an enterprise effort to generate revenue, representing the cost of doing business. This is treated on a consumed basis. It excludes cost incurred in the acquisition of income generating assets.
Intermediate expense are expenditures incurred in the production of goods such as materials and supplies used; fuels, lubricants, oils and greases used; electricity and water purchased, and industrial services done by others.
Value added is gross output less intermediate input. Gross output for the electricity, gas, steam, and air conditioning supply sector is value of output plus income from non-industrial services done for others (except rent income from land). Intermediate input is intermediate expense plus expense for non-industrial services done by others (except rent expense for land) and all other expenses.
Value of output represents the sum of the receipts from revenue from main activity, income from industrial services done for others, goods sold in the same condition as purchased less the cost of goods sold and value of fixed assets produced on own account.
Gross addition to tangible fixed assets is equal to capital expenditures less sale of fixed assets, including land.
Change in inventories is equivalent to the value of inventories at the end of the year less the value of inventories at the beginning of the year.
Subsidies are all special grants in the form of financial assistance or tax exemption or tax privilege given by the government to aid and develop an industry.
| Attachment | Size |
|---|---|
|
|
12.87 KB |
|
|
19.39 KB |
|
|
12.65 KB |
|
|
21.99 KB |