DECEMBER 2016
Year-on-Year and Month-on-Month Growth Rates
of General Retail Price Index
| All Items | December 2016 | November 2016 | December 2015 | Year-to-date |
|---|---|---|---|---|
| Year-on-Year | 4.3 | 3.6 | 1.0 | 2.3 |
| Month-on-Month | 0.5 | 0.4 | -0.1 |
Year-on-Year
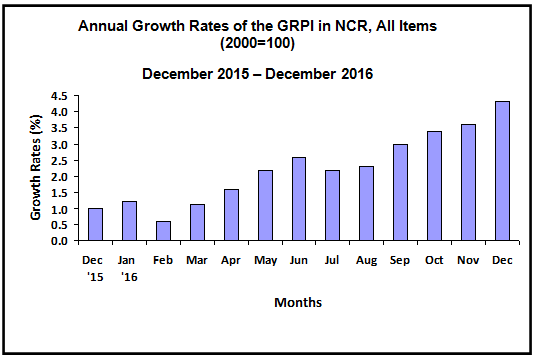
The annual growth of the General Retail Price Index (GRPI) in the National Capital Region (NCR) continued to move at a faster rate at 4.3 percent in December 2016. In the previous month, it picked up by 3.6 percent and in December 2015, 1.0 percent. This was mainly due to the 9.4 percent annual increase posted in the heavily-weighted food index. Contributing also to the uptrend were higher annual gains registered in the indices of crude materials, inedible except fuels at 1.2 percent and mineral fuels, lubricants and related materials, 5.2 percent. On the other hand, slower annual upticks were noted in the indices of chemicals, including animal and vegetable oils and fats at 0.8 percent; manufactured goods classified chiefly by materials, 1.6 percent; machinery and transport equipment, 0.2 percent; and miscellaneous manufactured articles, 0.6 percent. Annual movement of beverages and tobacco index remained at its previous month’s rate of 3.2 percent (Table 2).
The annual average change of GRPI for all items for the year 2016 rose by 2.3 percent. In 2015, its annual average growth was registered at 1.2 percent. Likewise, annual average rate in food index was higher at 5.6 percent. Moreover, from negative annual average change posted in the previous year, the index of machinery and transport equipment went up by 0.3 percent in 2016. On the contrary, the annual average mark-ups in the indices of beverages and tobacco decelerated to 2.4 percent; crude materials, inedible except fuels and miscellaneous manufactured articles, both at 0.6 percent; and chemicals, including animal and vegetable oils and fats, 1.0 percent. The index of manufactured goods classified chiefly by materials retained its previous year’s annual average rate of 1.0 percent while that for mineral fuels, lubricants and related minerals index declined by 5.5 percent (Table 2).

By Commodity Group, Month-on-Month (Table 3)
On a monthly basis, the GRPI in NCR inched up by 0.5 percent in December 2016. It posted a 0.4 percent growth in the previous month.
The food index went up by 1.1 percent during the month. This was brought about by higher prices of beef, chicken, canned meat, evaporated and condensed milk, fresh and frozen fish, shrimps and prawns, fresh fruits, vegetables, sugar and cooking oil.
Upward price adjustments in selected liquors and cigarettes resulted to a 0.2 percent growth in beverages and tobacco index.
The index of crude materials, inedible except fuel increased by 0.7 percent as pulpwood (charcoal) was priced higher during the month.
The index of manufactured goods classified chiefly by materials picked up by 0.1 percent. Price hikes of selected construction materials were observed this month.
Price add-ons in petroleum products such as gasoline, LPG and kerosene raised the index of mineral fuels, lubricants and related materials by 1.2 percent during the month. This was however, slower than its previous month’s rate of 1.4 percent.
A zero growth was registered in the indices of chemicals, including animal and vegetable oils and fats; machinery and transport equipment; and miscellaneous manufactured articles.
