
|
Table A Year-on-Year Growth Rates for Production Index, Net Sales Index
and Producer Price Index : December 2015 and December 2014
|
||
|---|---|---|
|
TOTAL MANUFACTURING |
DECEMBER
2015
|
DECEMBER
2014
|
|
Production Index (2000=100) |
|
|
|
Value (VaPI) |
-2.6 |
3.2 |
|
Volume (VoPI) |
4.9 |
4.7 |
|
Net Sales Index (2000=100) |
|
|
|
Value (VaNSI) |
-5.4 |
-3.9 |
|
Volume (VoNSI) |
2.0 |
-2.5 |
|
Producer Price Index (2000=100) |
-7.2r |
-1.4 |
r - revised
- Value of Production Index slides in December 2015
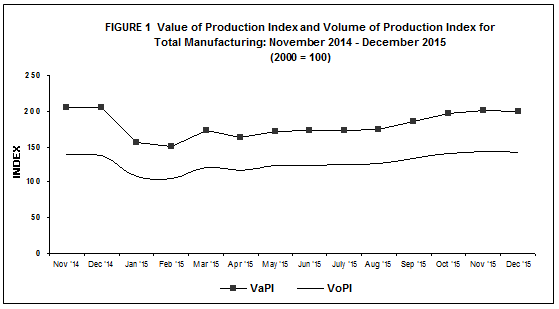
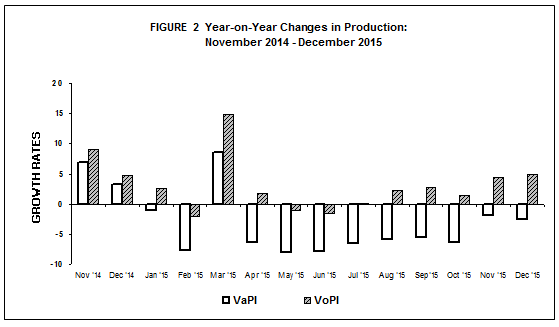
Value of Production Index (VaPI) for total manufacturing dropped in December 2015, posting an annual decrement of 2.6 percent, according to the preliminary results of the Monthly Integrated Survey of Selected Industries (MISSI). The decline was brought about by the contraction of VaPI in 11 major sectors, with significant decreases observed in the following: printing (-44.3%), petroleum products (-40.6%), furniture and fixtures (-27.4%), wood and wood products (-21.2%), fabricated metal products (-20.8%) and textiles (-10.1%). Refer to Tables 1-A and 1.
- Volume of Production sustains growth
Volume of Production Index (VoPI) maintained a positive growth registering at 4.9 percent in December 2015. Among the 13 major sectors that reported increases in VoPI, nine major sectors reported two-digit growth, namely: non-metallic mineral products (18.8%), paper and paper products (18.6%), machinery except electrical (17.8%), leather products (17.6%), miscellaneous manufactures (14.1%), transport equipment (13.0%), electrical machinery (12.1%), beverages (12.0%) and chemical products (10.4%). Refer to Tables 1-B and 2.
- Value of Net Sales decelerates further
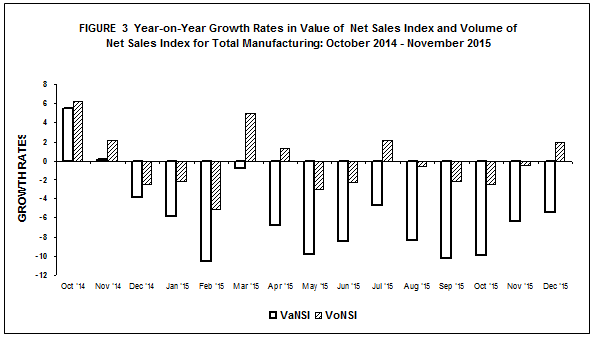
Value of Net Sales Index (VaNSI) continued to decrease exhibiting a decrement of 5.4 percent in December 2015. This was attributed to the decreases in VaNSI observed in nine major sectors led by printing (-61.7%), outpacing the increments in 11 major sectors. Other major sectors that significantly contributed to the decrease in VaNSI were furniture and fixtures (-25.6%), petroleum products (-19.0%) and basic metals (-16.7%). Refer to Tables 2-A and 3.
- Volume of Net Sales Index rebounds
Volume of Net Sales Index (VoNSI) in contrast, depicted a minimal annual growth of 2.0 percent in December 2015. Seven of the 12 major sectors that mainly influenced the growth were wood and wood products (51.5%), beverages (30.5%), paper and paper products (29.5%), non-metallic mineral products (22.5%), rubber and plastic products (21.6%), miscellaneous manufactures (15.0%) and tobacco products (10.2%). Refer to Tables 2-B and 4.
- Average Capacity Utilization Rate in December 2015 is 83.5 percent
Average capacity utilization rate in December 2015 for total manufacturing was recorded at 83.5 percent. Fifty-five percent or 11 of the 20 major industries operated at 80 percent and above capacity utilization rates. These were:
- basic metals (88.5%)
- petroleum products (88.2%)
- non-metallic mineral products (86.4%)
- machinery except electrical (85.2%)
- food manufacturing (84.4%)
- electrical machinery (84.3%)
- chemical products (84.0%)
- paper and paper products (83.1%)
- rubber and plastic products (82.5%)
- wood and wood products (80.8%)
- printing (80.2%)
The proportion of establishments that operated at full capacity (90% to 100%) was 27.3 percent in December 2015. About 54.4 percent of the establishments operated at 70 percent to 89 percent capacity while 18.3 percent of the establishments operated below 70 percent capacity. Refer to Table 6 and B.
|
Table B Distribution of Key Manufacturing Establishments by Capacity Utilization for Total Manufacturing: December 2015 |
|
|---|---|
|
Capacity Utilization |
Percent Share |
|
Below 50% |
3.2 |
|
50% - 59% |
4.2 |
|
60% - 69% |
10.9 |
|
70% - 79% |
21.0 |
|
80% - 89% |
33.4 |
|
90% - 100% |
27.3 |
- Industry Coverage
The 2015 MISSI utilizes the 2009 PSIC to classify major industries and sub-industries. Twenty major industries of the 2009 PSIC were formed to comprise the industry coverage of the 2015 MISSI. These are presented in the table below.
|
2009 PSIC CODE |
INDUSTRY DESCRIPTION |
|---|---|
|
C10 |
Food manufacturing * |
|
C11 |
Beverages |
|
C12 |
Tobacco products |
|
C13 |
Textiles* |
|
C14, C152 |
Footwear and wearing apparel |
|
C151 |
Leather products |
|
C16 |
Wood and wood products* |
|
C17 |
Paper and paper products |
|
C18 |
Printing |
|
C19 |
Petroleum products* |
|
C20,C21 |
Chemical products* |
|
C22 |
Rubber and plastic products* |
|
C23 |
Non-metallic mineral products* |
|
C24 |
Basic metals* |
|
C25,C3311 |
Fabricated metal products |
|
C262,C275,C28, C263,C268,C3312,C332 |
Machinery except electrical* |
|
C261,C264,C27, C29301,C3314,C332 |
Electrical machinery* |
|
C29 except C29301, C30,C3315 |
Transport equipment |
|
C31 |
Furniture and fixtures |
|
C265,C266,C267,C32, C3313,C3319 |
Miscellaneous manufactures |
|
Note: * - Major industries categorized into sub-industries |
|
- Response Rate
The response rates for the December 2015 MISSI and PPS are 74.2 and 80.8 percent, respectively. Refer to Tables 7 and 8.
|
Table C Response Rates for Total Manufacturing
(In percent)
|
||
|---|---|---|
|
|
December 2015 |
November 2015
(Revised)
|
|
MISSI |
74.2 |
81.2r |
|
PPS |
80.8r |
87.1r |
Data of non-responding samples were estimated using short-term geometric mean of the relative values of responding samples within the industry class. Revisions to the preliminary estimates are done upon receipt of actual reports of late respondents.
TABLE 1-A Value of Production Index, November 2015 and December 2015
(2000 =100)
|
Gainers |
Year-on-Year Growth (%) |
|
|---|---|---|
| December 2015 |
November 2015
(revised)
|
|
|
Machinery except electrical |
22.2 |
32.1 |
|
Chemical products |
10.5 |
8.9 |
|
Beverages |
15.2 |
1.0 |
|
Non-metallic mineral products |
18.2 |
4.7 |
|
Transport equipment |
9.9 |
-0.3 |
|
Paper and paper products |
18.8 |
2.0 |
|
Miscellaneous manufactures |
15.4 |
11.6 |
|
Footwear and wearing apparel |
1.5 |
5.1 |
|
Leather products |
19.2 |
16.4 |
|
Losers |
Year-on-Year Growth (%) |
|
|---|---|---|
| December 2015 |
November 2015
(revised)
|
|
|
Petroleum products |
-40.6 |
-34.5 |
|
Electrical machinery |
-4.3 |
-1.3 |
|
Printing |
-44.3 |
-21.3 |
|
Food manufacturing |
-2.7 |
-8.8 |
|
Basic metals |
-7.1 |
17.3 |
|
Fabricated metal products |
-20.8 |
0.6 |
|
Furniture and fixtures |
-27.4 |
-40.0 |
|
Textiles |
-10.1 |
-12.2 |
|
Tobacco products |
-6.7 |
34.0 |
|
Wood and wood products |
-21.2 |
-42.7 |
|
Rubber and plastic products |
-2.2 |
-0.9 |
TABLE 1-B Volume of Production Index, November 2015 and December 2015
(2000 = 100)
|
Gainers |
Year-on-Year Growth (%) |
|
|---|---|---|
| December 2015 |
November 2015
(revised)
|
|
|
Electrical machinery |
12.1 |
18.4 |
|
Machinery except electrical |
17.8 |
28.9 |
|
Chemical products |
10.4 |
6.1 |
|
Transport equipment |
13.0 |
-0.1 |
|
Beverages |
12.0 |
-6.5 |
|
Non-metallic mineral products |
18.8 |
10.8 |
|
Paper and paper products |
18.6 |
-2.0 |
|
Miscellaneous manufactures |
14.1 |
5.5 |
|
Basic metals |
5.5 |
32.0 |
|
Rubber and plastic products |
6.6 |
3.3 |
|
Footwear and wearing apparel |
3.1 |
8.0 |
|
Leather products |
17.6 |
15.0 |
|
Wood and wood products |
2.5 |
-26.1 |
|
Losers |
Year-on-Year Growth (%) |
|
|---|---|---|
| December 2015 |
November 2015
(revised)
|
|
|
Petroleum products |
-33.8 |
-26.0 |
|
Printing |
-43.4 |
-20.0 |
| Fabricated metal products |
-22.4 |
-0.9 |
|
Textiles |
-12.5 |
-12.7 |
|
Food manufacturing |
-1.3 |
-9.5 |
|
Tobacco products |
-3.3 |
32.8 |
|
Furniture and fixtures |
-1.3 |
-17.7 |
TABLE 2-A Value of Net Sales Index, November 2015 and December 2015
(2000 =100)
|
Gainers |
Year-on-Year Growth (%) |
|
|---|---|---|
| December 2015 |
November 2015
(revised)
|
|
|
Beverages |
34.3 |
27.9 |
|
Machinery except electrical |
11.3 |
4.8 |
|
Non-metallic mineral products |
21.9 |
2.8 |
|
Paper and paper products |
29.8 |
5.7 |
|
Miscellaneous manufactures |
16.2 |
4.9 |
|
Transport equipment |
6.7 |
-4.2 |
|
Rubber and plastic products |
11.5 |
7.9 |
|
Tobacco products |
6.2 |
45.3 |
|
Wood and wood products |
16.5 |
-12.0 |
|
Fabricated metal products |
1.4 |
12.3 |
|
Leather products |
3.4 |
7.8 |
|
Losers |
Year-on-Year Growth (%) |
|
|---|---|---|
| December 2015 |
November 2015
(revised)
|
|
|
Petroleum products |
-19.0 |
-22.0 |
|
Electrical machinery |
-8.2 |
-1.9 |
|
Food manufacturing |
-4.4 |
-14.5 |
|
Basic metals |
-16.7 |
7.2 |
|
Printing |
-61.7 |
-62.3 |
|
Chemical products |
-6.1 |
-3.3 |
|
Furniture and fixtures |
-25.6 |
-21.3 |
|
Textiles |
-3.6 |
-13.3 |
|
Footwear and wearing apparel |
-1.6 |
-5.9 |
TABLE 2-B Volume of Net Sales Index, November 2015 and December 2015
(2000 = 100)
|
Gainers |
Year-on-Year Growth (%) |
|
|---|---|---|
| December 2015 |
November 2015
(revised)
|
|
|
Beverages |
30.5 |
18.4 |
|
Electrical machinery |
7.6 |
17.7 |
|
Machinery except electrical |
7.3 |
2.3 |
|
Non-metallic mineral products |
22.5 |
8.8 |
|
Paper and paper products |
29.5 |
1.6 |
|
Transport equipment |
9.8 |
-4.0 |
|
Miscellaneous manufactures |
15.0 |
-0.8 |
|
Wood and wood products |
51.5 |
13.6 |
|
Rubber and plastic products |
21.6 |
12.5 |
|
Tobacco products |
10.2 |
44.0 |
|
Furniture and fixtures |
1.1 |
8.0 |
|
Leather products |
2.1 |
6.5 |
|
Losers |
Year-on-Year Growth (%) |
||
|---|---|---|---|
| December 2015 |
November 2015
(revised)
|
||
|
Petroleum products |
-9.8 |
-11.9 |
|
|
Printing |
-61.1 |
-61.6 |
|
|
Chemical products |
-6.1 |
-5.8 |
|
|
Food manufacturing |
-3.0 |
-15.1 |
|
|
Basic metals |
-5.4 |
20.6 |
|
|
Textiles |
-6.3 |
-13.9 |
|
|
Fabricated metal products |
-0.5 |
10.6 |
|
|
Footwear and wearing apparel |
1/ |
-3.4 |
|