
|
Table A Year-on-Year and Month-on-Month Growth Rates of Producer Price Index
September 2019, August 2019 and September 2018
|
|||
|---|---|---|---|
|
TOTAL MANUFACTURING |
September
2019
|
August
2019
|
September
2018
|
|
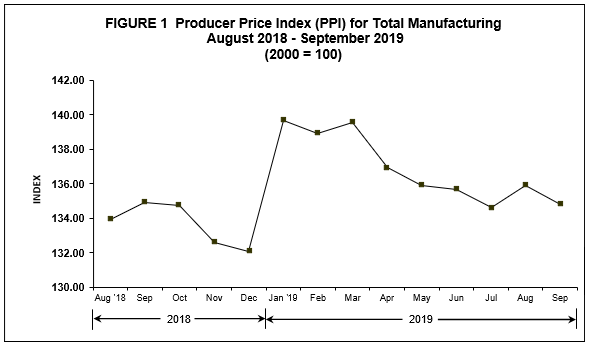
Producer Price Index (2000=100) |
134.8 |
135.9 r |
134.9 |
|
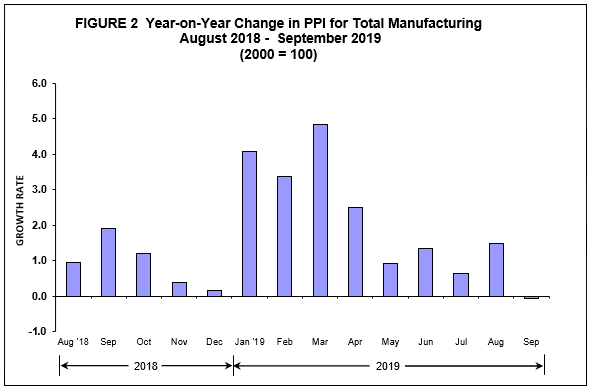
Year-on-Year Growth (%) |
-0.1 |
1.5 |
1.9 |
|
Month-on-Month Growth (%) |
-0.8 |
1.0 |
0.7 |
- Producer Price Index posts slight decrease in September 2019
The Producer Price Index (PPI, 2000=100) for manufacturing slowly declined at an annual rate of 0.1 percent in September 2019. This annual rate of the PPI was lower than its annual growth rate of 1.9 percent during the same period of the previous year and also lower than the annual growth rate of 1.5 percent in August 2019. The decline can be attributed to the decreases in the indices of 13 major industry groups led by petroleum products (-11.5%). On the other hand, furniture and fixtures, which climbed by 61.3 percent, led the six major industry groups that posted annual increases. Printing reflected flat growth. Refer to Tables 1 and A-1.
On a month-on-month performance, the PPI descended by 0.8 percent in September 2019. In August 2019, the PPI ascended at a monthly rate of 1.0 percent and in September 2018, it also ascended by 0.7 percent. Petroleum products, which declined by 2.3 percent, led the 14 major industry groups that pulled-down the PPI in September 2019. Meanwhile, printing reflected flat growth and the other five major industry groups posted increases. Refer to Tables 1 and A-2.
|
MAJOR INDUSTRY GROUP |
||
| September 2019 |
August 2019
|
|
|
Gainers |
|
|
|
Furniture & Fixtures |
61.3 |
64.9 |
|
Beverages |
3.6 |
3.6r |
|
Non-Metallic Mineral Products |
3.7 |
3.4r |
|
Tobacco Products |
4.0 |
4.1 |
|
Rubber & Plastic Products |
3.6 |
3.9r |
|
Miscellaneous Manufactures |
1.4 |
4.5 |
|
Printing |
0.0 |
0.0 |
|
Losers |
|
|
|
Food Manufacturing |
-5.2 |
-5.0r |
|
Petroleum Products |
-11.5 |
-6.8r |
|
Electrical Machinery |
-5.1 |
-3.5r |
|
Chemical Products |
-7.8 |
-6.7 |
|
Basic Metals |
-8.2 |
-7.7r |
|
Transport Equipment |
-3.0 |
-0.4r |
|
Machinery Except Electrical |
-4.7 |
-2.3 |
|
Fabricated Metal Products |
-10.5 |
-7.3r |
|
Footwear & Wearing Apparel |
-11.4 |
-9.1r |
|
Wood & Wood Products |
-8.5 |
-8.8r |
|
Paper & Paper Products |
-1.3 |
-2.0r |
|
Leather Products |
-2.5 |
-12.1 |
|
Textiles |
-1.0 |
-3.3 |
|
MAJOR INDUSTRY GROUP |
||
| September 2019 |
August 2019
|
|
|
Gainers |
|
|
|
Leather Products |
5.1 |
-1.7 |
|
Paper & Paper Products |
1.5 |
-0.4r |
|
Textiles |
1.3 |
0.3r |
|
Fabricated Metal Products |
a/ |
0.6 |
|
Beverages |
a/ |
a/ |
|
Printing |
0.0 |
0.0 |
| Losers |
|
|
|
Transport Equipment |
-1.8 |
1.9r |
|
Petroleum Products |
-2.3 |
-0.3 |
|
Chemical Products |
-1.6 |
-0.1r |
|
Food Manufacturing |
-0.4 |
-0.6r |
|
Machinery Except Electrical |
-1.3 |
3.6 |
|
Electrical Machinery |
-0.4 |
1.4r |
|
Basic Metals |
-0.6 |
0.2r |
|
Wood & Wood Products |
-1.7 |
3.0r |
|
Footwear & Wearing Apparel |
-0.8 |
1.8r |
|
Miscellaneous Manufactures |
-0.7 |
1.9 |
|
Furniture & Fixtures |
-1.3 |
1.7 |
|
Non-Metallic Mineral Products |
-0.2 |
0.1r |
|
Tobacco Products |
-0.1 |
0.2 |
|
Rubber & Plastic Products |
b/ |
0.1r |
CLAIRE DENNIS S. MAPA, Ph.D.
Undersecretary
National Statistician and Civil Registrar General
- Introduction
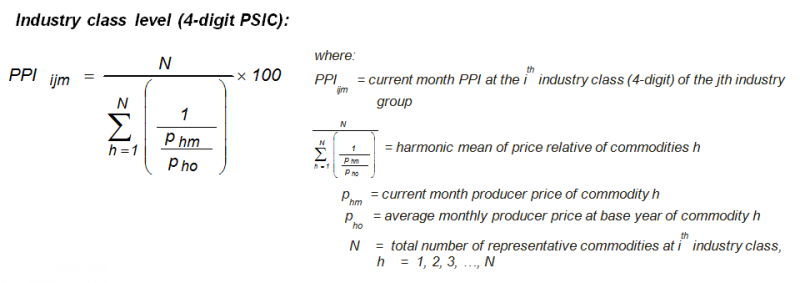
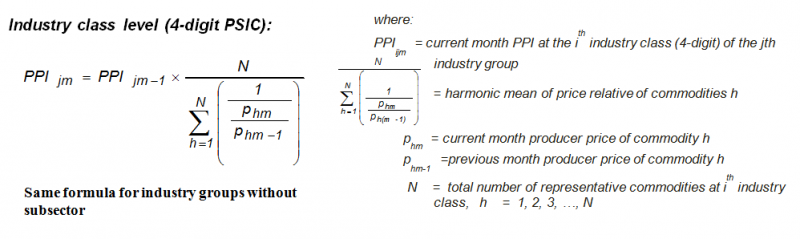
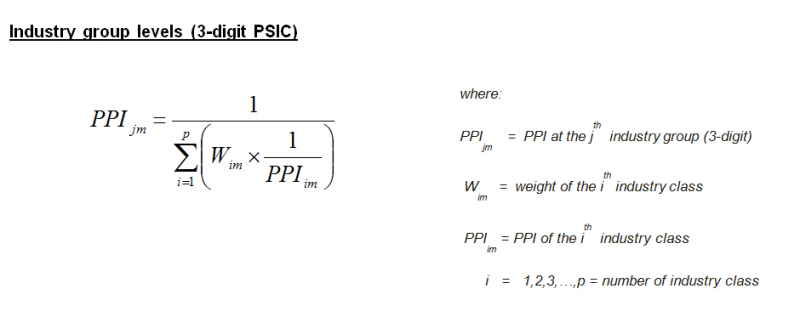
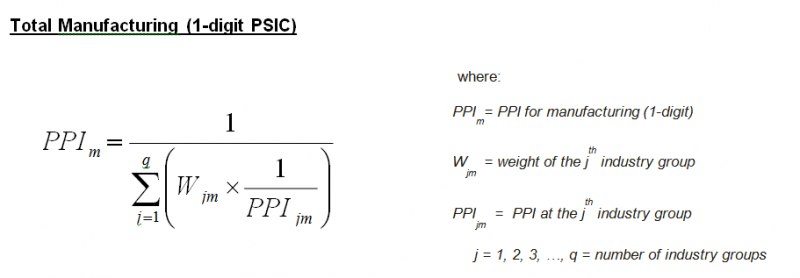
- Method of Index Computation
- Computation of Growth Rates
Year-on-year growth rates are computed by dividing the current month index by the index in the same month of the previous year less 1.
Month-on-month growth rates are computed by dividing the current month index by the previous month’s index less 1.
Starting with January 2017 PPI, a link factor has been used to adjust weight effects and measure the correct price change.
- Industry Coverage
Starting with January 2013 reference month, the PPI utilizes the 2009 Philippine Standard Industrial Classification (PSIC) to classify sectors and industries. Selected industry classes of the 2009 PSIC were grouped to form the 20 industry groupings of the 2019 PPS. These are presented in the table below.
|
2009 PSIC CODE |
INDUSTRY DESCRIPTION |
|---|---|
|
C10 |
Food manufacturing * |
|
C11 |
Beverages |
|
C12 |
Tobacco products |
|
C13 |
Textiles* |
|
C14, C152 |
Footwear and wearing apparel |
|
C151 |
Leather products |
|
C16 |
Wood and wood products* |
|
C17 |
Paper and paper products |
|
C18 |
Printing and reproduction of recorded media |
|
C19 |
Petroleum products* |
|
C20, C21 |
Chemical products* |
|
C22 |
Rubber and plastic products* |
|
C23 |
Non-metallic mineral products* |
|
C24 |
Basic Metals* |
|
C25 |
Fabricated metal products |
|
C262, C275, C28, C263, C268 |
Machinery except electrical* |
|
C261, C264, C27, C29301 |
Electrical machinery* |
|
C29 except C29301, C30 |
Transport equipment |
|
C31 |
Furniture and fixtures |
|
C265, C266, C267, C32 |
Miscellaneous manufactures |
Note: * - Major industry groups categorized into sub-industry classes
See more at the Producer Price Survey (PPS) main page.