Population of Tarlac increased at the rate of 1.76 percent annually
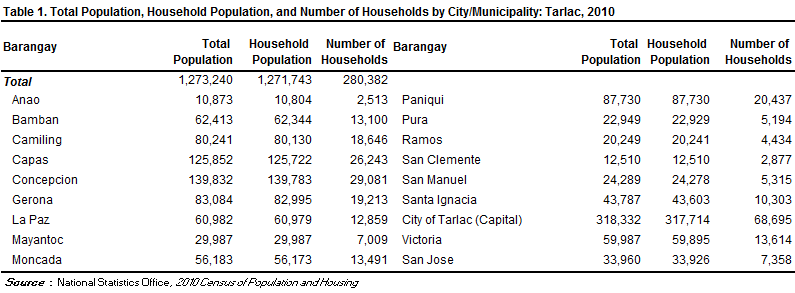
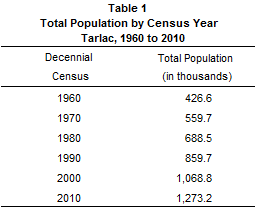
Based on the 2010 Census of Population and Housing (2010 CPH), the province of Tarlac posted a total population of 1,273,240 persons as of May 1, 2010. This is larger by 204,457 persons compared to its total population of 1,068,783 persons counted in the 2000 CPH. The increase in the population count from 2000 to 2010 translated to an average annual population growth rate (PGR) of 1.76 percent. This is lower than the 2.20 percent annual PGR of the province between the census years 1990 and 2000.
If the average annual PGR recorded at 1.76 percent during the period 2000 to 2010 continues, the population of Tarlac would double in 40 years.
Fifty years ago, the population of Tarlac was only 426,647 persons. This population size is more than one third of the population of the province in the 2010 CPH.
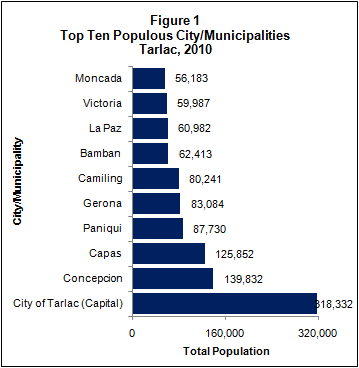
City of Tarlac was the most populous
Among the lone city and 17 municipalities comprising the province of Tarlac, the City of Tarlac, the provincial capital, was the most populous with a population size making up 25.0 percent of the total provincial population. The municipality of Concepcion was second with 11.0 percent share, followed by the municipalities of Capas with 9.9 percent, Paniqui with 6.9 percent, Gerona with 6.5 percent, and Camiling with 6.3 percent. The rest of municipalities contributed less than 5.0 percent each.
The least populated area was the municipality of Anao with 0.9 percent share to the total population of the province. It was also the least populated area in 2000.
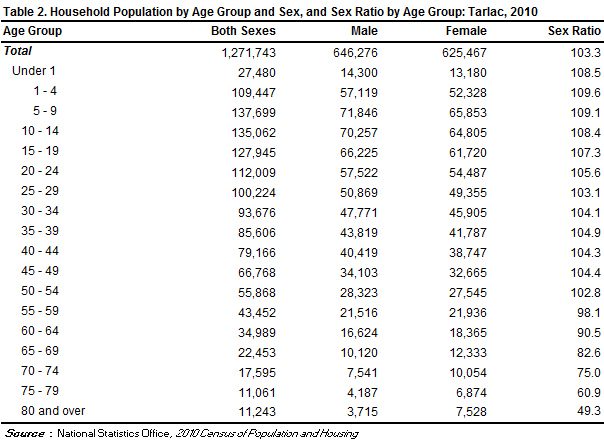
Sex ratio was 103 males per 100 females
Of the 1,271,743 household population in 2010, males accounted for 50.8 percent while females comprised 49.2 percent. These figures resulted in a sex ratio of 103 males for every 100 females. The recorded sex ratio in 2000 was the same as that in 2010.
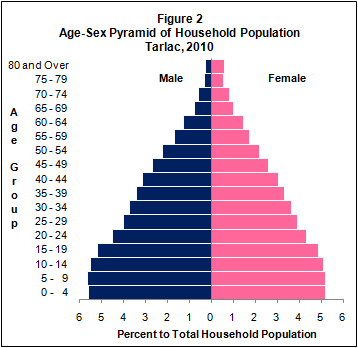
Median age increased to 24.4 years
In 2010, the median age of the population of the province was 24.4 years, which means that half of the population was younger than 24.4 years. This is higher than the median age of 22.3 years that was recorded in 2000.
Moreover, three in every 10 persons (32.2 percent) were under 15 years old. Children aged 0 to 4 years and 5 to 9 years (10.8 percent each) comprised the largest age groups, followed by those in the age group 10 to 14 years (10.6 percent). Males outnumbered females in the age groups 0 to 54 years. On the other hand, there were more females than males in the older age groups (55 years and over).
Three fifths of the population were of voting age
The voting-age population (18 years and over) accounted for 61.7 percent of the household population of the province in 2010, up from 58.3 percent in 2000. The distribution of males and females of voting age was equal at 50.0 percent.
Dependency ratio decreased to 59 dependents per 100 persons in the working age group
In 2010, the young dependents (0 to 14 years) comprised 32.2 percent of the household population while the old dependents (65 years and over) posted a share of 4.9 percent. The working-age population (15 to 64 years) accounted for the remaining 62.9 percent.
The overall dependency ratio was 59, which indicates that for every 100 working-age population, there were about 59 dependents (51 young dependents and eight old dependents). This ratio is lower than the dependency ratio in 2000, which was recorded at 66 dependents per 100 working-age population (59 young dependents and seven old dependents).
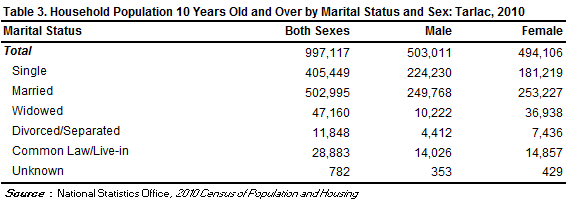
There were more males than females among the never-married persons
Of the household population 10 years old and over 50.4 percent were married while 40.7 percent were never married. The rest of the population were categorized as follows: widowed (4.7 percent), in common-law/live-in marital arrangement (2.9 percent), and divorced/separated (1.2 percent).
Among the never-married persons, 55.3 percent were males while 44.7 percent were females. For the rest of the categories for marital status, the females outnumbered the males.
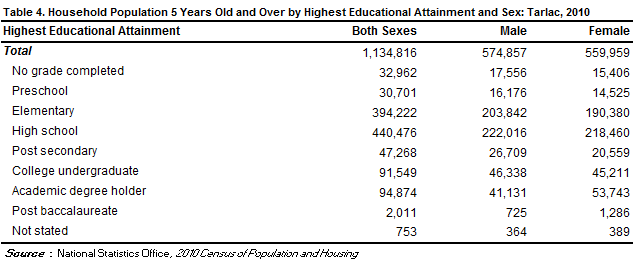
More females had attained higher levels of education
Of the household population aged five years and over, 34.7 percent had attended or completed elementary education, 38.8 percent had reached or finished high school, 8.1 percent were college undergraduates, and 8.4 percent were academic degree holders. Among those with an academic degree, the females (56.6 percent) outnumbered the males (43.4 percent). Similarly, more females (63.9 percent) than males (36.1 percent) had pursued post baccalaureate courses.
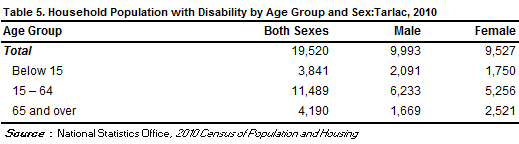
Persons with disability comprised 1.5 percent of the population in the province
In 2010, around 19,500 persons or 1.5 percent of the 1,271,743 household population had a disability. This proportion of persons with disability (PWD) is higher than the proportion in 2000, which was 1.0 percent of the 1,067,996 household population of the province during that year. The number of PWD for the same year was around 10,300 persons.
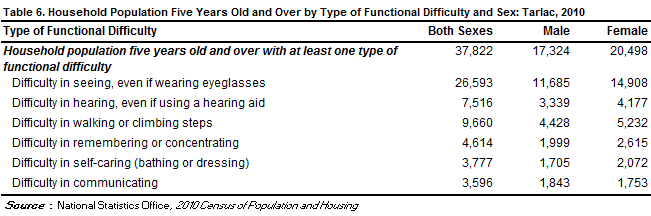
There were more females than males among those with functional difficulty
Of the 1,134,816 household population five years and over, 3.3 percent (or 37,822 persons) had at least one type of functional difficulty either in seeing, hearing, walking or climbing steps, remembering or concentrating, self-caring (bathing or dressing), or communicating. There were more females (54.2 percent) than males (45.8 percent) among those persons with at least one type of functional difficulty.
Moreover, of the total 37,822 persons aged five years and over with at least one type of functional difficulty, 70.3 percent reported difficulty in seeing, even if wearing eyeglasses. There were 25.5 percent who had difficulty in walking or climbing steps; 19.9 percent had difficulty in hearing, even if using a hearing aid; 12.2 percent had difficulty in remembering or concentrating; 10.0 percent had difficulty in self-caring (bathing or dressing); and 9.5 percent had difficulty in communicating.
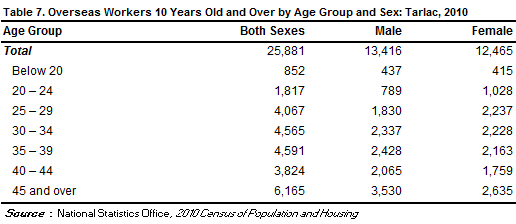
Male overseas workers outnumbered their female counterparts
Of the 997,117 household population 10 years old and over in Tarlac, 2.6 percent (or 25,881 persons) were overseas workers. Male overseas workers outnumbered their female counterparts as they comprised 51.8 percent of all the overseas workers from this province. Overseas workers aged 45 years and over made up the largest age group, comprising 23.8 percent of the total overseas workers from this province in 2010, followed by the age groups 35 to 39 (17.7 percent), 30 to 34 years (17.6 percent), and 25 to 29 years (15.7 percent).
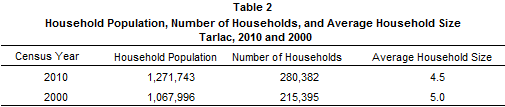
Average household size was 4.5 persons
The number of households in 2010 was recorded at 280,382, higher by 64,987 households compared with the 215,395 households posted in 2000. The average household size in 2010 was 4.5 persons, lower than the average household size of 5.0 persons in 2000.
There were 102 households per 100 occupied housing units
A total of 275,375 occupied housing units were recorded in the province of Tarlac in 2010. This translates to a ratio of 102 households for every 100 occupied housing units, with 4.6 persons per occupied housing unit. In 2000, there were 102 households per 100 occupied housing units, and 5.1 persons per occupied housing unit.
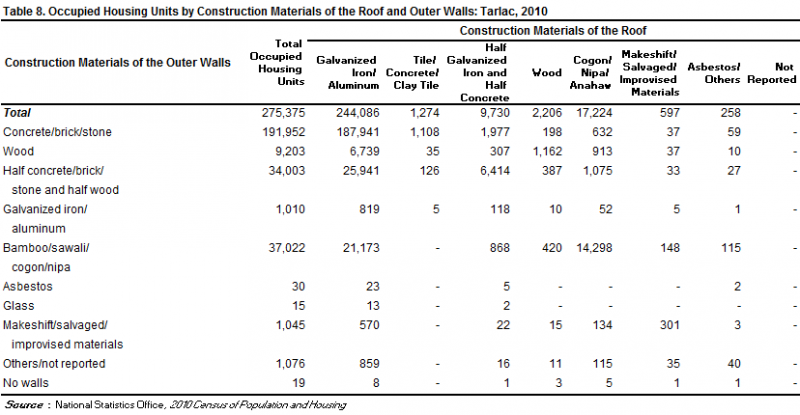
Occupied housing units with outer walls and roofs made of strong materials increased
In 2010, 69.7 percent of the occupied housing units in the province had outer walls made of concrete/brick/stone, higher than the proportion of 49.6 percent recorded in 2000. The proportion of occupied housing units with outer walls made of bamboo/sawali/cogon/nipa decreased from 23.2 percent in 2000 to 13.4 percent in 2010. Those with walls made of half concrete/brick/stone and half wood decreased from 18.8 percent in 2000 to 12.3 percent in 2010. Meanwhile, majority (88.6 percent) of the occupied housing units in 2010 had roofs made of galvanized iron/aluminum. This is higher than the proportion of 77.9 percent recorded in 2000. Those with roofs made of cogon/nipa/anahaw decreased from 12.8 percent in 2000 to 6.3 percent in 2010.
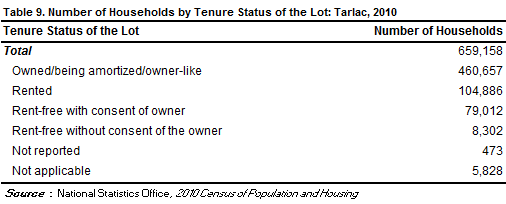
Majority of the households lived in lots that they owned or amortized
In 2010, of the total 280,382 households, 76.4 percent owned or amortized the lots that they occupied. The corresponding figure in 2000 was 61.2 percent.
Moreover, 16.9 percent of the households occupied lots which were rent-free but with consent of the owner, 4.1 percent rented the lots that they occupied while 1.8 percent occupied lots which were rent-free but without consent of the owner.