Hog Farming Dominates the Agriculture and Forestry Sector
- The total number of establishments in the agriculture and forestry sector in 2005 was estimated to be 3.295. Of the total establishments' count. majority (79.1%) were agriculture and forestry establishments with average total employment (ATE) of less than 20 and the remaining 20.9 percent were establishments with ATE of 20 and more.
- Hog farming accounted for the biggest number of establishments among industries. which was recorded at 769 or 23.3 percent of the total. This was followed closely by chicken broiler production (651 establishment or 19.8%) and growing of palay. corn. coconut. sugarcane. fruits. beverage and spice crops. and other related crops (617 establishments or 18.7%). Establishments engaged in forestry activities recorded the least number of establishments at 42 (1.3%). Figure 1 displays the distribution of establishments by industry group for the agriculture and forestry sector.

Establishments Engaged in Growing of Palay. Corn. Coconut. Sugarcane. Fruits. Beverage and Spice Crops. and Other Related Crops Employs Majority of Workers for the Sector
- Total employment of the sector during the year 2005 was estimated at 124.818. Employment in establishments with ATE of 20 and more numbered 104.603 workers or equivalent to 83.8 percent of total employment for the sector. The remaining 16.2 percent were employed by establishments with ATE of less than 20 workers.
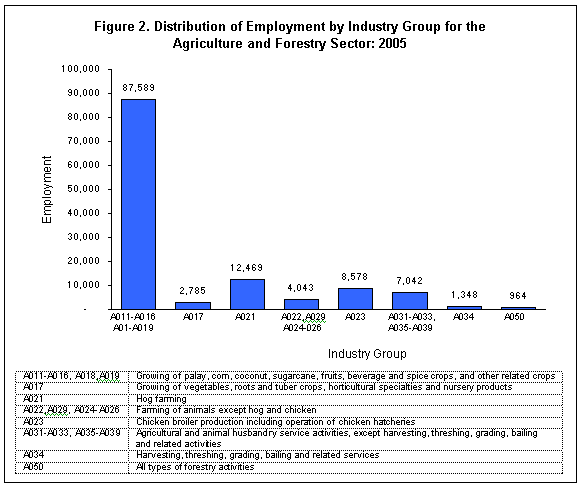
- Majority of the workers (70.2% or 87.589 workers) were employed by establishments engaged in the growing of palay. corn. coconut. sugarcane. fruits. beverage and spice crops. and other related crops. Hog farming. which recorded the highest number of establishments. ranked a far second in terms of employee generation with 12.469 workers or 10.0 percent to total employment. This was followed by chicken broiler production including the operation of chicken hatcheries and agricultural and animal husbandry service activities with respective shares of 6.9 percent and 5.6 percent to total employment. Figure 2 shows the distribution of employment by industry group for the agriculture and forestry sector.

Average Annual Compensation is P87.6 Thousand per Agricultural and Forestry Worker
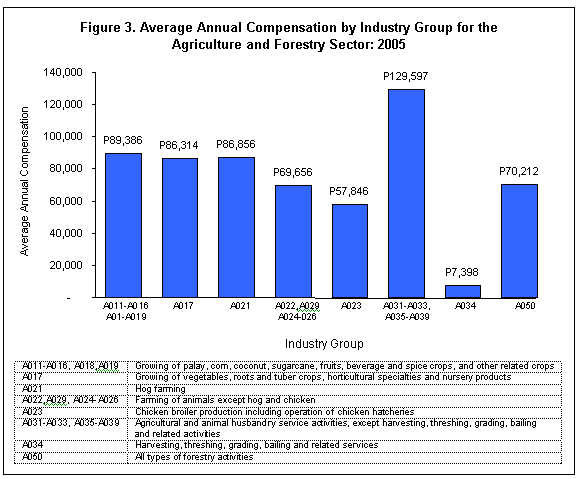
- Total compensation paid in 2005 amounted to P10.6 billion. translating to an average annual compensation of P87.612 per paid agricultural and forestry worker.
- Among industries. agricultural and animal husbandry service activities paid the highest average annual compensation per worker amounting to P129.597. Figure 3 compares the average annual compensation by industry groups for the agriculture and forestry sector.

Establishments Engaged in Growing of Palay. Corn. Coconut. Sugarcane. Fruits. Beverage and Spice Crops. and Other Related Crops Generates P28.2 Billion in Revenue
- Total revenue earned during the year 2005 by all agriculture and forestry establishments in the country was estimated at P51.2 billion. Agriculture and forestry establishments with ATE of 20 and more workers accounted for a lion's share of 85.9 percent (P44.0 billion) to total revenue.
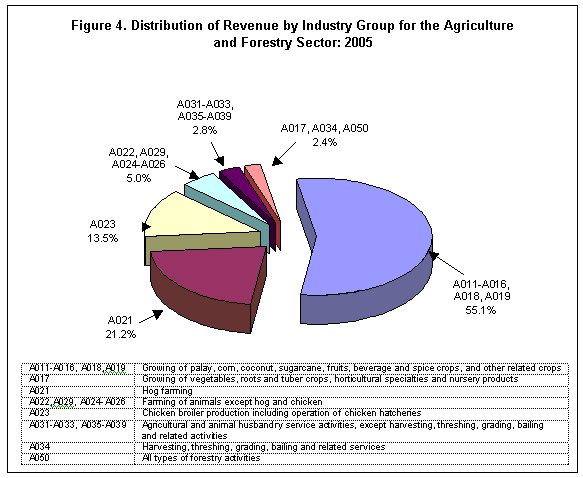
- More than half (55.1%) of the total revenue generated by the sector was earned by establishments engaged in growing of palay. corn. coconut. sugarcane. fruits. beverage and spice crops. and other related crops as it grossed P28.2 billion in 2005. Other industries that earned revenues exceeding a billion mark were hog farming (P10.8 billion). chicken broiler production including the operation of chicken hatcheries (P6.9 billion). farming of animals except hog and chicken (P2.6 billion). and agricultural and animal husbandry service activities (P1.5 billion). Figure 4 shows the distribution of revenue by industry group for the agriculture and forestry sector.
- Total cost. except compensation. incurred by all agriculture and forestry establishments amounted to P39.3 billion.

Hog Farming Industry Recorded the Highest Labor Productivity
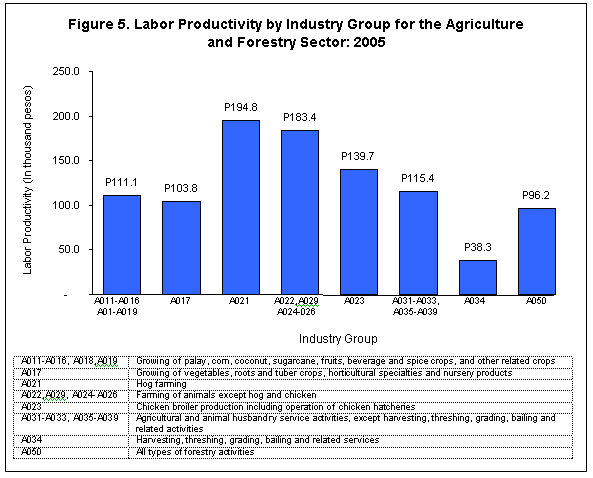
- Labor productivity for the sector. measured as the ratio of value added to total employment. was estimated at P122.976.
- The highest labor productivity was recorded by the hog farming industry amounting to P194.832 in 2005 while it was lowest for establishments engaged in harvesting. threshing. grading. bailing and related services at P38.291. Figure 5 compares the labor productivity by industry groups for the agriculture and forestry sector.

TECHNICAL NOTES
The 2005 Annual Survey of Philippine Business and Industry (ASPBI) is a continuing activity of the National Statistics Office aimed at collecting information on the structure and levels of economic activities in the country. It is the 38th in the series of annual survey of establishments conducted by the Office and the 14th in the series for the agriculture and forestry sector.
The survey is undertaken by authority of five (5) legislative acts and presidential directives namely: Commonwealth Act No. 591. Presidential Decree No. 418. Executive Order No. 121. Executive Order No. 352. and Executive Order No. 5.
The reference year of the survey is 2005.
Scope and Coverage
The unit of enumeration of the survey is the establishment. It is defined as an economic unit under a single ownership or control. engaged in one or predominantly one kind of economic activity at a single fixed location. Establishments are classified according to economic sectors. which are the scope of the survey. Fourteen sectors of the Philippine economy are covered in the 2005 ASPBI.
One of these sectors is the agriculture and forestry. The sector is comprised of 27 industry groups as classified in the amended 1994 Philippine Standard Industrial Classification (PSIC). namely:
- growing of palay
- growing of corn. except young corn (vegetable)
- growing of coconut. including copra making. tuba gathering and coco-shell charcoal making in the farm
- growing of banana
- growing of sugarcane. including muscovado sugar-making in the farm
- growing of fruits (except banana) and nuts
- growing of vegetables. roots and tuber crops. horticultural specialties and nursery products
- growing of beverage crops and spice crops
- growing of crops. not elsewhere classified.
- hog farming
- livestock farming (except hog)
- chicken broiler production (including operation of chicken hatcheries)
- poultry farming (except chicken)
- egg production
- dairy farming
- animal farming. not elsewhere classified.
- operation of irrigation system through cooperatives and non-cooperatives
- planting. transplanting and other related services
- services to establish crops. promote their growth and protect them from pests and diseases
- harvesting. threshing. grading. bailing and related services
- rental of farm machinery with drivers and crew
- cotton ginning
- services to promote propagation. growth and output of animals
- farm management services
- agricultural and animal husbandry service activities. except veterinary activities. n.e.c.
- hunting. trapping. and game propagation including related service activities
- forestry. logging and related service activities.
Sampling Design
Stratified systematic sampling was utilized to select samples for the 2005 ASPBI. The updated 2004 List of Establishments (LE) was the frame used to draw the sample establishments.
Employment size. defined as the average total employment (ATE) of an establishment. served as the stratification variable. The domains were region and industry for the group of establishments with ATE of 20 and more. For establishments with ATE of less than 20. the whole country and industry served as the domains.
The amended 1994 Philippine Standard Industrial Classification (PSIC) was used to classify establishments according to economic activity from which they derive their major income or revenue. On the other hand. geographic locations were classified according to the Philippine Standard Geographic Classification (PSGC).
Response Rate
Questionnaires were distributed to sample establishments starting in April 3 to April 28. 2006. The respondents were generally given 30 days within which to accomplish the questionnaires. Collection of accomplished questionnaires was programmed from May 2. 2006 until August 31. 2006. Manual and machine processing. and tabulation of data were undertaken in the Central Office.
The effective response rate is 75.7 percent for the agriculture and forestry sector. For establishments with ATE of 20 and more workers. the effective response rate is 78.9 percent while that for establishments with ATE of less than 20 workers is 64.1 percent.
Concepts and Definition of Terms
Establishments - is an economic unit under single ownership or control. i.e.. under a single legal entity. engaged in one or predominantly one kind of economic activity at a single fixed location. and having permanency of assets in its premises during the operation. It is also defined as the unit that is engaged in the production of the most homogenous group of goods and services. usually at one location. but sometimes over a wider area. for which separate records are available that can provide data concerning the production of these goods and services and the materials. labor and physical resources used in this production.
Agricultural Establishments - Farm. plantation. hacienda. ranch or company engaged in the production of agricultural crops. livestock. poultry and other animals including animal products; firm providing agricultural. animal and horticultural services.
Forestry Establishments A company engaged in logging operation; planting. replanting and conservation of forest; hunting. trapping and game propagation.
Economic activity or business is the activity of the establishment as classified under the 1994 Philippine Standard Industrial Classification (PSIC). Generally. the main activity of the establishment is the establishment's principal source of income. If the establishment is engaged in several activities. its main activity is that which earns the biggest income or revenue.
Average total employment (ATE) is the sum of the number of persons who worked in or for this establishment for all months of the year divided by 12. regardless of the number of months the establishment is in operation.
Total Employment includes all persons who worked in or for the establishment as of November 15. 2005.
Paid employees are all persons working in the establishment and receiving pay. as well as those working away from the establishment paid by and under the control of the establishment. Included are all employees on sick leave. paid vacation or holiday. Excluded are consultants. home workers. workers receiving pure commissions only and workers on indefinite leave.
Working owners are owners who are actively engaged in the management but do not receive regular pay. i.e.. not included in the payrolls. Managers and directors of corporations working for pay are reported as managers.
Compensation is the sum of gross salaries and wages and employer's contributions to SSS/GSIS and the like.
Unpaid workers are persons working for at least one-third of the working time normal to the establishment and do not receive regular pay.
Salaries and wages are payments in cash or in kind to all employees. prior to deductions for employee's contributions to SSS/GSIS. withholding tax. etc. Included are total basic pay. overtime pay and other benefits.
Overtime pay are payments given for extra hours worked.
Other benefits include bonuses. cost of living allowances. commutable transportation and representation allowances. food. housing. commissions paid to salaried employees. separation. retirement. terminal pay. gratuities. etc. Excluded are cost of uniform/working clothes and reimbursable transportation and representation allowances.
Employer's Contribution to SSS/GSIS and the like refers to payments made by the establishment on behalf of the employees. Examples are SSS. GSIS. Employees Compensation Commission (ECC). Philhealth and PAGIBIG.
Revenue includes cash received and receivables for goods sold and services rendered. Valuation is at producer's prices (ex-establishment). net of discounts and allowances. including duties and taxes but excluding subsidies.
Cost refers to all expenses incurred during the year whether paid or payable. Valuation is at market prices including taxes and other charges. net of rebates. returns and allowances. Goods and services received by the establishment from other establishments of the same enterprise are valued as though purchased.
Capital expenditures for fixed assets include cost of acquisition of new and used fixed assets; fixed assets produced by the establishment for its own use; major alterations. additions and improvements to fixed assets. whether done by others or on own account. Fixed assets received from other establishments belonging to the same enterprise are valued as though purchased.
Gross addition to fixed assets is equal to capital expenditures less sale of fixed assets. including land.
Inventories refer to the stock of goods owned by and under the control of the establishment as of a fixed date. regardless of where the stocks are located. Valuation should be at current replacement cost in purchaser's (market) prices. Replacement cost is the cost of an item in terms of its present price rather than its original cost.
Change in inventories is computed as the total value of ending inventory less the total beginning inventory.
Value added represents the value of agricultural products sold and services rendered. receipts from industrial and non-industrial services done for others. receipts from goods bought and sold in the same condition. fixed assets produced on own account and change in inventories (ending less beginning of finished products. work-in-progress. goods for resale and materials and supplies) less the cost of materials and supplies. goods for resale. industrial and non-industrial services done for others. electricity purchased and fuels purchased.
Detailed Statistical Tables
The detailed tables at the national and regional levels are available upon request from the Industry Statistics Division. National Statistics Office. 4th Floor Solicarel Bldg II. Ramon Magsaysay Blvd.. Sta. Mesa. Manila Tel. No. (062) 716-39-32.
Source: National Statistics Office
Manila. Philippines
