
Animal production industry represents one-third of the total establishments
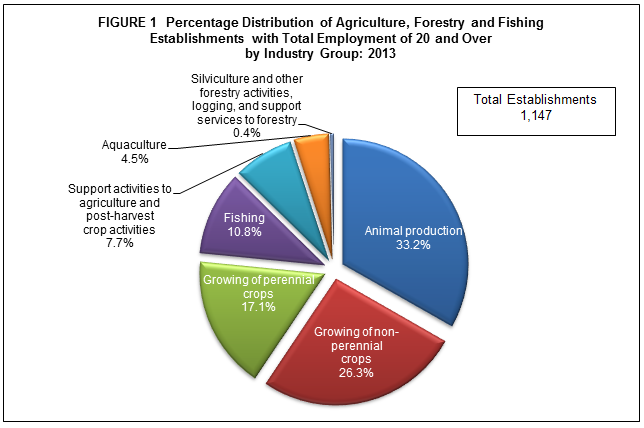
The preliminary results of the 2013 Annual Survey of Philippine Business and Industry (ASPBI) showed that the country had a total of 1,147 establishments with total employment (TE) of 20 and over engaged in agriculture, forestry and fishing in the formal sector of the economy.
Among industry groups, animal production led the sector with 381 establishments, accounting for 33.2 percent of the total number of establishments. Growing of non-perennial crops came next with 301 or 26.3 percent. Growing of perennial crops followed with 196 establishments or 17.1 percent share.
The remaining 23.4 percent (269 establishments) of the total were engaged in the following:
Fishing, 124 establishments (10.8%)
Support activities to agriculture and post-harvest crop activities,88 establishments (7.7%)
Aquaculture, 52 establishments (4.5%)
Silviculture and other forestry activities, logging,and support services to forestry, 5 establishments (0.4%)
Figure 1 displays the percentage distribution of agriculture, forestry and fishing establishments with TE of 20 and over by industry group in 2013.
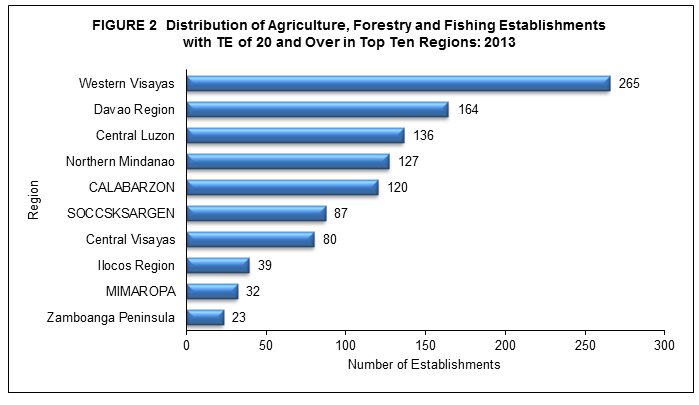
At the regional level, Western Visayas led the regions where a total of 265 establishments (23.1%) were located. Davao Region followed next with 164 establishments (14.3%). Other regions with more than a hundred number of establishments are as follows:
Central Luzon, 136 establishments (11.9%)
Northern Mindanao, 127 establishments (11.1%)
CALABARZON, 120 establishments (10.5%)
Figure 2 shows the top ten regions in terms of number of agriculture, forestry and fishing establishments with TE of 20 and over in 2013.
Growing of perennial crops leads in employment generation
Total employment of agriculture, forestry and fishing establishments with TE of 20 and over reached 148,638 in 2013. About 99.1 percent or 147,266 workers of the total employment were paid employees while the remaining 0.9 percent were working owners and unpaid workers.
Employment generated by the top two industries comprised more than two-thirds (67.6%) of the total. Growing of perennial crops emerged as the top employer with 62,417 workers or 42.0 percent of the total. This was followed by growing of non-perennial crops which employed a quarter of the total or 38,098 workers. Figure 3 shows the distribution of employment for agriculture, forestry and fishing establishments with TE of 20 and over by industry group in 2013.

At the regional level, Davao Region, which ranked second in terms of number of establishments, emerged as the largest employment generator with 35,786 workers or 24.1 percent of the total. Western Visayas came next with 28,974 workers (19.5%), followed by Northern Mindanao with 18,155 workers (12.2%).
The average number of workers per establishment for the sector was recorded at 130. Among industries, growing of perennial crops posted the highest average with 318 workers. Silviculture and other forestry activities, logging, and support services to forestry placed second with 156 workers.
Employees in support activities to agriculture and post-harvest crop activities receive the highest average annual compensation
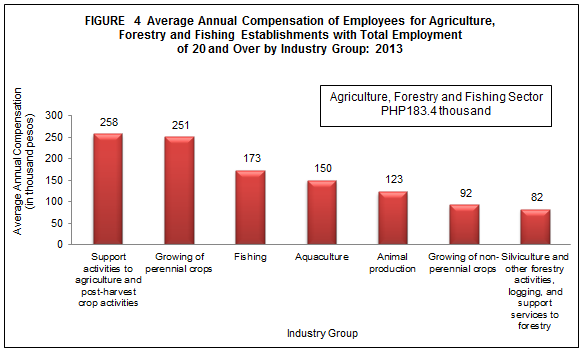
Total compensation paid by the sector to its employees in 2013 amounted to PHP27.0 billion, translating to an average annual compensation of PHP183,397 per employee.
By industry group, growing of perennial crops paid the highest total compensation of PHP15.6 billion, comprising more than half (57.8%) of the total. Growing of non-perennial crops activities placed a far second with PHP3.5 billion (13.0%). Fishing activities ranked third with PHP2.5 billion (9.3%).
Employees in support activities to agriculture and post-harvest crop activities earned an average annual compensation of PHP257,963. Other industries paying an average annual compensation of more than a hundred thousand are as follows:
Growing of perennial crops, PHP250,826
Fishing, PHP173,220
Aquaculture, PHP149,590
Animal production, PHP123,158
Figure 4 shows the average annual compensation of employees for agriculture, forestry and fishing establishments with total employment of 20 and over by industry group in 2013.
At regional level, employees in Caraga received the highest average annual compensation of PHP380,797 per employee. Employees in National Capital Region (NCR) and Northern Mindanao followed with respective average annual pay of PHP286,841 and PHP273,760.
Growing of perennial crops generates almost half of total value of output
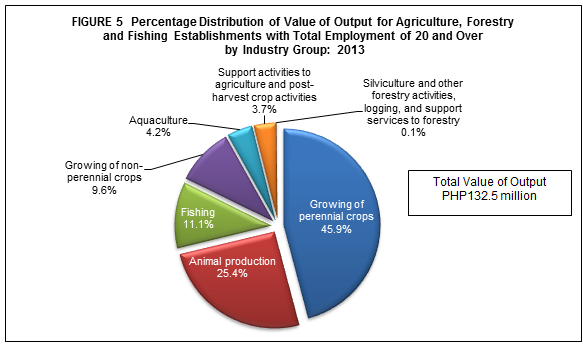
Total value of output generated by agriculture, forestry and fishing establishments with TE of 20 and over reached PHP132.5 billion in 2013.
By industry, almost half (45.9%) or PHP60.8 billion of the total value of output was generated by establishments engaged in growing of perennial crops. This was followed by animal production and fishing with respective shares of PHP33.6 billion (25.4%) and PHP14.6 billion (11.1%). Figure 5 illustrates the percentage distribution of value of output for agriculture, forestry and fishing establishments with total employment of 20 and over by industry group in 2013.
Across regions, combined value of output of the top three regions in 2013 comprised 62.5 percent of the total. Davao Region generated the highest value of output with PHP31.8 billion or 24.0 percent. Northern Mindanao and SOCCSKSARGEN followed with output value of PHP26.8 billion (20.2%) and PHP24.3 billion (18.3%), respectively.
Total expense reaches PHP135.4 billion
Total expense, including compensation, for agriculture, forestry and fishing establishments with TE of 20 and over amounted to PHP135.4 billion.
Among industries, growing of perennial crops incurred the highest expense amounting to PHP62.5 billion or 46.2 percent. Animal production ranked second with PHP33.0 billion (24.3%), followed by fishing with PHP14.8 billion (10.9%).
Agriculture, forestry and fishing establishments located in Mindanao area spent the most in 2013. The following are the top three regions which comprised 62.1 percent of the total expense:
Davao Region, PHP32.6 billion (24.1%)
Northern Mindanao, PHP27.1 billion (20.0%)
SOCCSKSARGEN, PHP24.4 billion (18.0%)
Income per expense ratio stands at 1.01
The sector generated a modest income per expense ratio of 1.01 in 2013. This means that for every peso spent, a corresponding income of PHP1.01 was generated.
Among industries, growing of non-perennial crops recorded the highest income per expense ratio of 1.14 while support activities to agriculture and post-harvest crop activities posted the lowest ratio of 0.71. Below are the remaining industries and their corresponding income per expense ratio:
Silviculture and other forestry activities, logging, and support services to forestry, 1.08
Animal production, 1.04
Fishing, 1.02
Growing of non-perennial crops, 1.01
Aquaculture, 0.97
Growing of perennial crops generates the highest value added
In 2013, value added produced by establishments with TE of 20 and over was estimated at PHP36.9 billion.
Growing of perennial crops generated PHP18.9 billion or more than half (51.3%) of the total, the highest among the industries. This was followed by growing of non-perennial crops and animal production with respective value of PHP6.0 billion (16.4%) and PHP4.9 billion (4.9%).
At the regional level, Davao Region accounted for the biggest share to value added amounting to PHP9.5 billion or 25.8 percent of the total, followed by SOCCSKSARGEN with PHP6.8 billion (18.4%) and Northern Mindanao with PHP 6.5 billion (17.6%). On the other hand, Bicol Region shared the least with PHP0.4 million or 1.1 percent of the total.
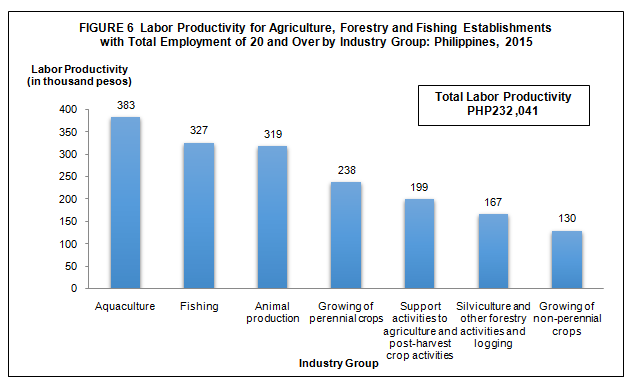
Aquaculture industry posts the highest productivity
Ratio of value added to employment, a measure of labor productivity, was recorded at PHP248,376 per worker in 2013.
Aquaculture activities generated a labor productivity of PHP414,868 per worker, the highest among industries. Growing of perennial crops ranked second with PHP303,414 per worker while fishing activities came next with PHP288,616 per worker. Figure 6 displays the labor productivity for agriculture, forestry and fishing establishments with total employment of 20 and over by industry group in 2013.
Employees in Central Luzon were the most productive in 2013, registering a ratio of PHP498,392. This was followed closely by employees in Caraga and SOCCSKSARGEN with respective productivity of PHP491,512 and PHP402,489 per worker.
Gross addition to tangible fixed assets reaches PHP10.8 billion
Gross addition to tangible fixed assets acquired by agriculture, forestry and fishing establishments reached PHP10.8 billion in 2013.
Combined share of the top two industries accounted for almost two-thirds (62.2%) of the total gross addition to tangible fixed assets. Growing of perennial crops acquired PHP3.4 billion (31.5%) worth of gross addition to fixed assets and PHP3.3 billion (30.8%) for support activities to agriculture and post-harvest crop activities.
Across the country, NCR led all regions in terms of gross addition to tangible fixed assets with a total value of PHP3.5 billion or 32.4 percent share to the total. SOCCSKSARGEN placed second with PHP1.8 billion (16.9%). Other regions with more than a billion share to total gross addition to fixed assets are as follows:
Davao Region, PHP1.7 billion (15.5%)
Central Luzon, PHP1.4 billion (12.5%)
Northern Mindanao, PHP1.1 billion (10.2%)
Total subsidies received amounts to PHP6.3 billion
Subsidies granted by the government to support the business operation of agriculture, forestry and fishing establishments with TE of 20 and over in 2013 amounted to PHP6.3 billion.
Establishments engaged in support activities to agriculture and post-harvest crop activities located in NCR were the only recipient of subsidies in 2013.
TECHNICAL NOTES
Introduction
This Special Release presents the preliminary results of the 2013 ASPBI for the agriculture, forestry and fishing establishments with total employment of 20 and over.
The 2013 ASPBI is a forerunner of the 2010 ASPBI and one of the designated statistical activities of the Philippine Statistics Authority (PSA). Data collected from the survey provide information on the levels, structure, performance, and trends of economic activities of the formal sector in the entire country for the year 2013.
The survey was conducted nationwide in September 2014 with the year 2013 as the reference period of data, except for employment which is as of November 15, 2013.
Data are presented at the national and industry group or 3-digit 2009 Philippine Standard Industrial Classification (PSIC) and at the regional level.
Legal Authority
The conduct of the 2013 ASPBI is authorized under Republic Act 10625 known as the Philippine Statistical Act of 2013 - Reorganizing and strengthening of the Philippine Statistical System (PSS), its agencies and instrumentalities.
Scope and Coverage
The 2013 ASPBI covered establishments engaged in 18 economic sectors classified under the 2009 PSIC, namely:
Agriculture, Forestry, and Fishing (A)
Mining and Quarrying (B)
Manufacturing (C)
Electricity, Gas, Steam, and Air Conditioning Supply (D)
Water Supply; Sewerage, Waste Management and Remediation Activities (E)
Construction (F)
Wholesale and Retail Trade; Repair of Motor Vehicles and Motorcycles (G)
Transportation and Storage (H)
Accommodation and Food Service Activities (I)
Information and Communication (J)
Financial and Insurance Activities (K)
Real Estate Activities (L)
Professional, Scientific and Technical Activities (M)
Administrative and Support Service Activities (N)
Education (P)
Human Health and Social Work Activities (Q)
Arts, Entertainment, and Recreation (R)
Other Service Activities (S)
The survey was confined to the formal sector of the economy, which consists of the following:
Corporations and partnership
Cooperatives and foundations
Single proprietorship with employment of 10 and over
Single proprietorships with branches
Frame of Establishments
The frame for the 2013 ASPBI was extracted from the 2013 List of Establishments (LE). The estimated number of establishments in operation in the country in 2013 totaled to 941,000. About 263,000 establishments (28.0% of the total establishments) belong to the formal sector of which 239,000 (87.0%) comprised the establishment frame. This frame was used to draw the sample establishments for the survey.
Unit of Enumeration
The unit of enumeration for the 2013 ASPBI is the establishment. An establishment is defined as an economic unit under a single ownership or control which engages in one or predominantly one kind of activity at a single fixed location.
Classification of Establishments
An establishment is categorized by its economic organization, legal organization, industrial classification, employment size, and geographic location.
Economic Organization refers to the organizational structure or role of the establishment in the organization. An establishment may be single establishment, branch, establishment and main office with branches elsewhere, main office only, and ancillary unit other than main office.
Legal Organization refers to the legal form of the economic entity which owns the establishment. An establishment may be single proprietorship, partnership, government corporation, stock corporation, non-stock corporation, and cooperative.
The industrial classification of an economic unit was determined by the activity from which it derives its major income or revenue. The 2009 PSIC was utilized to classify economic units according to their economic activities.
The size of an establishment is determined by its total employment (TE) as of a specific date.
Geographic Classification. Establishments are also classified by geographic area using the Philippine Standard Geographic Code (PSGC) classification.
Methodology
Sampling Design
The 2013 ASPBI used stratified systematic sampling with five-digit PSIC serving as first stratification variable and TE as the second stratification variable.
For establishments with TE 20 and over, the 17 administrative regions serve as the geographic domains while the 5-digit level of the 2009 PSIC serves as the industry domains.
Estimation Procedure for Establishments with TE of 20 and over
Non-Certainty Stratum (strata of TE 20 to 49 and TE 50 to 99)
The estimate of the total of a characteristic![]() for the non-certainty employment strata in an industry domain in each region was
for the non-certainty employment strata in an industry domain in each region was

where:
s denotes the non-certainty employment strata in TE of 20 and over
p = 1, 2,..., 17 regions (geographic domains)
xspj = value of the jth establishment in the non-certainty employment strata
in TE of 20 and over for an industry domain in each region
j = 1, 2, 3,…, nsp establishments
![]() = weight of the jth establishment in the non-certainty employment strata
= weight of the jth establishment in the non-certainty employment strata
in TE of 20 and over for an industry domain in each region

Nsp = total number of establishments in the non-certainty employment strata
in TE of 20 and over for an industry domain in each region
nsp = number of sample establishments in the non-certainty employment strata
in TE of 20 and over for an industry domain in each region
Certainty Stratum (TE 100 and over)
The estimate of the total of a characteristic ![]() for the certainty employment stratum in an industry domain in each region was
for the certainty employment stratum in an industry domain in each region was

where:
c denotes the certainty employment strata in TE of 20 and over
p = 1, 2,..., 17 regions (geographic domains)
xcpj = value of the jth establishment in the certainty employment strata
in TE of 20 and over in an industry domain within each region
j = 1, 2, 3, …, mcp establishments
mcp = number of establishments in the certainty employment strata
in TE of 20 and over in an industry domain within each region
- Total Estimate for TE of 20 and Over
The estimate of the total of a characteristic ![]() for the industry domain in each region (geographic domain) was obtained by aggregating the estimates for all employment strata (non-certainty and certainty) in the same industry domain,
for the industry domain in each region (geographic domain) was obtained by aggregating the estimates for all employment strata (non-certainty and certainty) in the same industry domain,

where dp denotes the industry domains in each region.
National level estimates of the characteristics by industry domain were obtained by aggregating separately the estimates ![]() for the particular industry domain from all the regions.
for the particular industry domain from all the regions.
Weight Adjustment Factor for Non-Response
To account for non-response in the non-certainty strata, the adjustment factor (n/n’) was multiplied with the sampling weight (W) of each of the sampling unit. The sampling weight, defined as N/n, was recomputed as

Thus, the adjusted weight (W’spj) for the non-certainty employment stratum for the industry domain with TE 20-99 was

where:
Nsp = total number of establishments in the non-certainty employment stratum
with TE 20-99 for the industry domain within each geographic domain (region)
n’sp = number of responding establishments in the non-certainty employment stratum
with TE 20-99 for the industry domain within each geographic domain (region)
Response Rate
Response rate for Agriculture, Forestry and Fishing Sector for establishments with TE of 20 and over was 86.1 percent (721 out of 837 establishments). This included receipts of "good" questionnaires, partially accomplished questionnaires, reports of closed, moved out or out of scope establishments.
Reports of the remaining non-reporting establishments were imputed based on established imputation methods and from other available administrative data sources. However, reports of establishments which were found to be duplicates and out of business in 2013, were not imputed.
Limitation of Data
The 2013 ASPBI covered only the formal sector of the economy.
Concepts and Definitions of Terms
Economic activity is the establishment’s source of income. If the establishment is engaged in several activities, its main economic activity is that which earns the biggest income or revenue.
Total employment is the number of persons who worked in for the establishment as of November 15, 2013.
Paid employees are all persons working in the establishment and receiving pay, as well as those working away from the establishment paid by and under the control of the establishment. Included are all employees on sick leave, paid vacation or holiday. Excluded are consultants, home workers, receiving pure commissions only, and workers on indefinite leave.
Compensation is the sum of salaries and wages, separation/retirement/terminal pay, gratuities, and payments made by the employer in behalf of the employees such as contribution to SSS/GSIS, ECC, PhilHealth, Pag-ibig, etc.
Salaries and wages are payments in cash or in kind to all employees, prior to deductions for employee’s contributions to SSS/GSIS, withholding tax, etc. Included are total basic pay, overtime pay and other benefits.
Income or Revenue refers to cash received and receivables for goods/products and by-products sold and services rendered.
E-commerce refers to the selling of products or services over electronic systems such as Internet Protocol-based networks and other computer networks. Electronic Data Interchange (EDI) network, or other on-line system. Excluded are orders received from telephone, facsimile and e-mails.
Cost refers to all expenses incurred during the year whether paid or payable. Valuation is at purchaser prices including taxes and other charges, net of rebates, returns and allowances. Goods and services received by the establishment from other establishments of the same enterprise are valued as though purchased.
Expense refers to cost incurred by the establishment during the year whether paid or payable. This is treated on a consumed basis.
Intermediate expense are expenditures incurred in the production of goods such as materials and supplies purchased, fuels purchased, electricity and water purchased, agricultural/forestry/fishery and industrial services done by others plus beginning inventory of materials, supplies and fuels less ending inventory of materials, supplies and fuels.
Value added is gross output less intermediate input. Gross output for the agriculture, forestry and fishing sector is value of output non-industrial services done for others (except rent income from land). Intermediate input is intermediate expenses plus non-industrial services done by others (except rent expense for land) and other costs.
Value of output represents the sum of the receipts from products and by-products sold, agricultural/forestry/fishery services rendered, industrial services, and goods sold in the same condition as purchased less the cost of goods sold; and value of fixed assets produced on own account and change in inventories of finished products and work-in-progress.
Gross addition to tangible fixed assets is equal to capital expenditures less sale of fixed assets, including land.
Change in inventories is equivalent to the value of inventories at the end of the year less the value of inventories at the beginning of the year.
Inventories refer to the stock of goods owned by and under the control of the establishment as of a fixed date, regardless of where the stocks are located. Valuation is at current replacement cost in purchaser prices. Replacement cost is the cost of an item in terms of its present price rather than its original cost.
Subsidies are all special grants in the form of financial assistance or tax exemption or tax privilege given by the government to aid and develop an industry.