
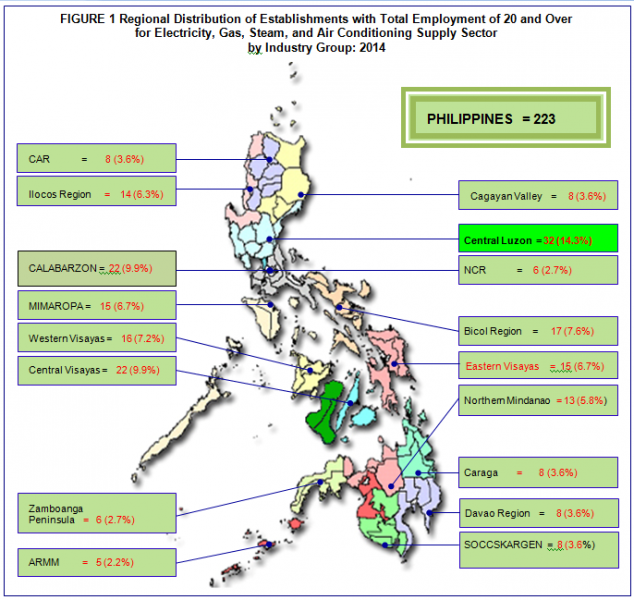
- Central Luzon leads in terms of number of establishments
Based from the preliminary results of the 2014 Annual Survey of Philippine Business and Industry (ASPBI) conducted nationwide, there were a total of 223 establishments engaged in electricity, gas, steam and air conditioning supply with total employment (TE) of 20 and over.
The 223 establishments were all engaged in electric power generation, transmission and distribution. No establishment was engaged in manufacturing of gas, distribution of gaseous fuel through mains and steam, air conditioning supply and production of ice in 2014. (Table 1)
The top three regions, in terms of number of establishments, accounted for more than one-third (34.1%) of the total. Central Luzon led other regions with 32 establishments or 14.3 percent of the total. This was followed by CALABARZON and Central Visayas with 22 establishments or 9.9 percent each. On the other hand, Autonomous Region in Muslim Mindanao (ARMM) recorded the least count with only 5 establishments (2.2%).
Figure 1 shows the regional distribution of all electricity, gas, steam, and air conditioning supply establishments with TE of 20 and over in 2014.
- Total employment reaches 46,561
In 2014, electricity, gas, steam and air conditioning supply establishments with TE of 20 and over generated a total of 46,561 workers.
The top three regions, in terms of employment generation, were all loacated in Luzon. National Capital Region (NCR) employed the most number of workers with 9,401 or 20.2 percent of the total. This was followed by Central Luzon with 5,257 workers (11.3%) and CALABARZON with 4,711 workers (10.1%).
The average number of workers per establishment for this sector was recorded at 209. NCR recorded the highest average employment of 1,567, followed distantly by Zamboanga Peninsula and Northern Mindanao with 229 and 219 workers per establishment, respectivelyhe average number of workers.
- CALABARZON pays the highest average annual compensation
Total compensation, which consists of gross salaries and wages, separation and retirement/terminal pay, gratuities, employers’ contribution to SSS/GSIS, and other benefits amounted to PHP32.4 billion in 2014. This translates to an average annual compensation of PHP696,107 per employee.
By region, CALABARZON paid the highest average annual compensation of PHP1,089,513 per employee. NCR and Eastern Visayas paid an average annual compensation per employee of PHP990,576 and PHP951,822, respectively. ARMM paid the least average annual compensation per employee of PHP190,856..
Figure 2 shows the average annual compensation of employees in the electricity, gas, steam and air-conditioning supply establishments with total employment of 20 and over by region in 2014.

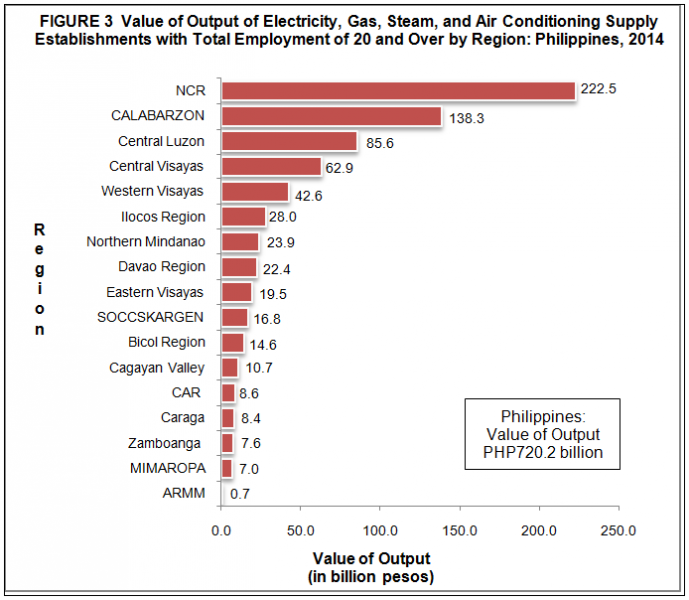
- NCR generates about 31 percent of total value of output
Total value of output generated by establishment with TE of 20 and over amounted to PHP720.2 billion.
Among the regions, NCR generated the highest value of output with PHP222.5 billion representing 30.9 percent of the total, followed by CALABARZON with PHP138.3 billion or 19.2 percent. Central Luzon placed third with value of output equivalent to PHP85.6 billion or 11.9 percent. ARMM reported the least value of output at PHP0.7 billion or 0.1 percent of the total.
Figure 3 shows the value of output for all electricity, gas, steam and air conditioning supply establishments with TE of 20 and over by region in 2014..
- NCR incurs highest expense in 2014
Total expense, including compensation, incurred in business operation of electricity, gas, steam and air conditioning supply establishments with TE of 20 and over in 2014 amounted to PHP643.1 billion.
NCR spent the highest among the regions estimated at PHP193.1 billion (30.0%), followed by CALABARZON spending PHP130.9 billion (20.4%). Central Luzon placed third with PHP76.8 billion (11.9%). ARMM spent the least amount with only PHP1.0 billion (0.2%)..
- CAR leads in terms of income per expense ratio
Income per expense ratio for establishments with TE of 20 and over in 2014 was recorded at 1.20, indicating that for every peso spent PHP1.20 was realized in terms of income.
Among regions, Cordillera Administrative Region (CAR) registered the highest return at 1.68 income per peso expense. This was followed by Ilocos Region and Northern Mindanao, with 1.66 and 1.40 income per peso expense, respectively.
- NCR contributes the highest share to total value added
Value added generated by electricity, gas, steam and air conditioning supply establishments with total employment of 20 and over reached PHP185.4 billion in 2014.
By region, NCR accounted for the biggest share to total value added amounting to PHP59.8 billion or 32.3 percent of the total. This was followed by CALABARZON and Central Luzon with PHP31.9 billion (17.2%) and PHP17.6 billion (9.5%), respectively.
- Labor productivity is PHP4.0 million per worker
The ratio of value added per worker, a simple measure of labor productivity, was estimated at PHP4.0 million per worker for establishments with TE of 20 and over.
By region, CALABARZON was the most productive region recording a ratio of PHP6.8 million per worker. SOCCSKARGEN placed second generating a labor productivity of PHP6.7 million while NCR ranked third with labor productivty of PHP6.4 million per worker.
- Gross addition to tangible fixed assets amounts to PHP41.0 billion
Gross addition to tangible fixed assets was estimated at PHP41.0 billion in 2014.
Regional profile shows that SOCCSKARGEN reported the highest gross addition to tangible fixed assets valued at PHP8.3 billion or 20.3 percent of the total. NCR followed at PHP7.7 billion or 18.8 percent of the total. Western Visayas placed third with PHP6.4 billion (15.5%).
- Total subsidies reaches PHP11.1 billion
Total subsidies provided by the government to support the business operation of electricity, gas, steam and air conditioning supply establishments with TE of 20 and over was estimated at PHP11.1 billion.
Among regions, NCR received the highest subsidy estimated at PHP2.2 billion or 19.8 percent of the total. This was followed by Northern Mindanao and Bicol Region with subsidies amounting to PHP1.8 billion (15.9%) and PHP1.4 billion (12.4%), respectively.
TECHNICAL NOTES
- Introduction
This Special Release presents the preliminary results of the 2014 ASPBI for the Electricity, Gas, Steam and Air Conditioning Supply sector for establishments with total employment of 20 and over..
The 2014 ASPBI is one of the designated statistical activities of the Philippine Statistics Authority (PSA). Data collected from the survey provide information on the levels, structure, performance, and trends of economic activities of the formal sector in the entire country for the year 2014. The 2014 Survey of Tourism Establishments in the Philippines was undertaken as a rider to this survey.
The survey was conducted nationwide in April 2015 with the year 2014 as the reference period of data, except for employment which is as of November 15, 2014.
Data are presented at the national and industry group or 3-digit 2009 Philippine Standard Industrial Classification (PSIC) and at the regional level.
- Legal Authority
TThe conduct of the 2014 ASPBI is authorized under Republic Act 10625 known as the Philippine Statistical Act of 2013 - Reorganizing and strengthening of the Philippine Statistical System (PSS), its agencies and instrumentalities.
- Scope and Coverage
The 2014 ASPBI covered establishments engaged in 18 economic sectors classified under the 2009 PSIC, namely:
- Agriculture, Forestry and Fishing (A)
- Mining and Quarrying (B)
- Manufacturing (C)
- Electricity, Gas, Steam, and Air Conditioning Supply (D)
- Water Supply; Sewerage, Waste Management and Remediation Activities (E)
- Construction (F)
- Wholesale and Retail Trade; Repair of Motor Vehicles and Motorcycles (G)
- Transportation and Storage (H)
- Accommodation and Food Service Activities (I)
- Information and Communication (J)
- Financial and Insurance Activities (K)
- Real Estate Activities (L)
- Professional, Scientific and Technical Activities (M)
- Administrative and Support Service Activities (N)
- Education (P)
- Human Health and Social Activities (Q)
- Arts, Entertainment and Recreation (R)
- Other Service Activities (S)
The following sections of the 2009 PSIC are excluded from the scope of this survey and all other establishment-based surveys of PSA:
- Public Administration and Defense; Compulsory Social Security (Section O)
- Activities of Households as Employers; Undifferentiated Goods and Services Producing Activities of Households for Own Use (Section T)
- Activities of Extra-territorial Organization and Bodies (Section U)
The survey was confined to the formal sector of the economy, which consists of the following:
- Corporations and partnership
- Cooperatives and foundations
- Single proprietorship with employment of 10 and over
- Single proprietorships with branches
Hence, the 2014 ASPBI covered only the following economic units:
- All establishments with total employment of 10 and over; and
- All establishments with total employment of less than 10, except those with Legal Organization = 1 (Single proprietorship) and Economic Organization = 1 (Single establishments), that are engaged in economic activities described according to the 2009 PSIC
- Frame
The frame for the 2014 ASPBI was extracted from the 2014 List of Establishments (LE). The estimated number of establishments in operation in the country in 2014 totaled to 944,500. About 266,257 establishments (28.0% of the total establishments) belong to the formal sector of which 231,241 (87.0%) comprised the establishment frame. This frame was used to draw the sample establishments for the survey.
- Unit of Enumeration
The unit of enumeration for the 2014 ASPBI is the establishment. An establishment is defined as an economic unit under a single ownership or control which engages in one or predominantly one kind of activity at a single fixed location.
- Classification of Establishments
An establishment is categorized by its economic organization, legal organization, industrial classification, employment size, and geographic location.
Economic Organization relates to the organizational structure or role of the establishment in the organization. An establishment may be single establishment, branch, establishment and main office with branches elsewhere, main office only, and ancillary unit other than main office.
Legal Organization refers to the legal form of the economic entity that owns the establishment. This provides the legal basis for ownership. An establishment may be single proprietorship, partnership, government corporation, stock corporation, non-stock corporation, and cooperative.
Industrial classification of an economic unit was determined by the activity from which it derives its major income or revenue. The 2009 PSIC was utilized to classify economic units according to their economic activities.
Size of an establishment is determined by its total employment (TE) as of a specific date.
Geographic Classification refers to the classification of establishments by geographic area using the Philippine Standard Geographic Code (PSGC) classification.
- Methodology
Sampling Design
The survey utilized stratified systematic sampling with 5-digit PSIC serving as the industry strata and employment size as the second stratification variable.
For establishments with TE of 20 and over, the 17 administrative regions serve as the geographic domains while the 5-digit level (sub-class) of the 2009 PSIC serves as the industry domain.
Estimation Procedure
a. Non-Certainty Stratum (strata TE of 20-49 and TE of 50-99)
The estimate of the total of a characteristic  for the non-certainty employment strata in TE of 20 and over for an industry domain in each region (geographic domain) is
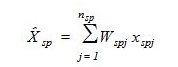
where:
s denotes the non-certainty employment strata in TE of 20 and over
p = 1, 2,..., 17 regions (geographic domains)
xspj = value of the jth establishment in the non-certainty employment strata in TE of 20 and over for an industry domain in each region
j = 1, 2, 3,…, nsp establishments
Wspj = weight of the jth establishment in the non-certainty employment strata in TE of 20 and over for an industry domain in each region
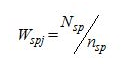
Nsp = total number of establishments in the non-certainty employment strata in TE of 20 and over for an industry domain in each region
nsp = number of sample establishments in the non-certainty employment strata in TE of 20 and over for an industry domain in each region
b. Certainty Stratum
The estimate of the total of a characteristic  for the certainty employment stratum in TE of 20 and over in an industry domain in each geographic domain (region) is
where:
c denotes the certainty employment stratum in TE of 20 and over
p = 1, 2,..., 17 regions (geographic domains)
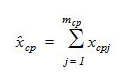
xcpj = value of the jth establishment in the certainty employment stratum in TE of 20 and over in an industry domain within each region
J = 1, 2, 3, …, mcp establishments
mcp = number of establishments in the certainty employment stratum in TE of 20 and over in an industry domain within each region
c. Total Estimate for TE of 20 and Over
The estimate of the total of a characteristic  for the industry domain in each region (geographic domain) was obtained by aggregating the estimates for all employment strata (non-certainty and certainty) in the same industry domain,

where
dp denotes the industry domains in each region
National level estimates of the characteristics by industry domain were obtained by aggregating separately the estimates  for the particular industry domain from all the regions.
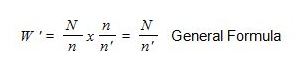
Weight Adjustment Factor for Non-Response
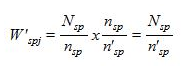
To account for non-response in the non-certainty strata, the adjustment factors, and (n/n’) was multiplied with the sampling weight (W) of each of the sampling unit. The sampling weight which is defined as N/n was recomputed as
For the non-certainty employment stratum in TE of 20-49 or 50-99, the adjusted weight (W’spj) is
where:
- Response Rate
Response rate for Electricity, Gas, Steam, and Air Conditioning Supply sector for establishments with TE of 20 and over was 80.9 percent (220 out of 272 establishments). This included receipts of "good" questionnaires, partially accomplished questionnaires, reports of closed, moved out or out of scope establishments.
Reports of the remaining non-reporting establishments were imputed based on established imputation methods and from other available administrative data sources. However, reports of establishments which were found to be duplicates and out of business in 2014, were not imputed.
- Limitation of Data
The 2014 ASPBI covered only the formal sector of the economy.
- Concepts and Definitions of Terms
Economic Activity is the establishment’s source of income. If the establishment is engaged in several activities, its main economic activity is that which earns the biggest income or revenue.
Total employment is the number of persons who worked in for the establishment as of November 15, 2014.
Paid employees are all full-time and part-time employees working in or for the establishment and receiving pay, as well as those working away from the establishment and paid by and under the control of the establishment. Included also are all employees on sick or maternity leave, paid vacation or holiday and on strike. Excluded are directors paid solely for their attendance at meetings, consultants, workers on indefinite leave, working owners who do not receive regular pay, home workers and 98 workers receiving pure commissions only.
Compensation is the sum of salaries and wages, separation, terminal pay and gratuities paid by the establishment to its employees and total employer’s contribution to SSS/GSIS, ECC, PhilHealth, PAG-IBIG etc.
Salaries and wages are payments in cash or in kind to all employees, prior to deductions for employee’s contributions to SSS/GSIS, withholding tax, etc. Included are total basic pay, overtime pay and other benefits.
Income or Revenue includes cash received and receivables for goods/products and by-products sold and services rendered. Valuation is at producer prices (ex-establishment) net of discounts, and allowances, including duties and taxes but excluding subsidies.
E-Commerce refers to the selling of products or services over electronic systems such as the Internet Protocol-based networks and other computer networks, Electronic Data Interchange (EDI) network, or other on-line system. Excluded are orders received from telephone, facsimile and e-mails
Expense refers to cost incurred by the establishment in an enterprise’s effort to generate revenue, representing the cost of doing business. This is treated on a consumed basis. It excludes cost incurred in the acquisition of income generating assets.
Intermediate expense are expenditures incurred in the production of goods such as materials and supplies used, fuels, lubricants, oils and greases used; electricity and water purchased, agricultural/forestry/fishery and industrial services done by others.
Value added is gross output less intermediate input. Gross output is value of output plus income from non-industrial services done for others (except rent income from land). Intermediate input is intermediate expense plus expense for non-industrial services done by others (except rent expense for land) and all other expense.
Value of output represents the sum of the sale of products and by-products, income from industrial services done for others, sale of goods less cost of goods sold, fixed assets produced on own account, and change in inventories of finished products and work-in-progress.
Gross addition to tangible fixed assets is equal to capital expenditures less sale of fixed assets, including land.
Change in Inventories is computed as the value of ending inventory less the beginning inventory.
Inventories refer to the stock of goods owned by and under the control of the establishment as of a fixed date, regardless of where the stocks are located. Valuation is at current replacement cost in purchaser prices. Replacement cost is the cost of an item in terms of its present price rather than its original cost.
Subsidies refer to special grants received from the government in the form of financial assistance or tax exemption or tax privilege to aid and develop an industry.
| Attachment | Size |
|---|---|
|
|
20.8 KB |
|
|
19.52 KB |
|
|
23.64 KB |
|
|
22.33 KB |