
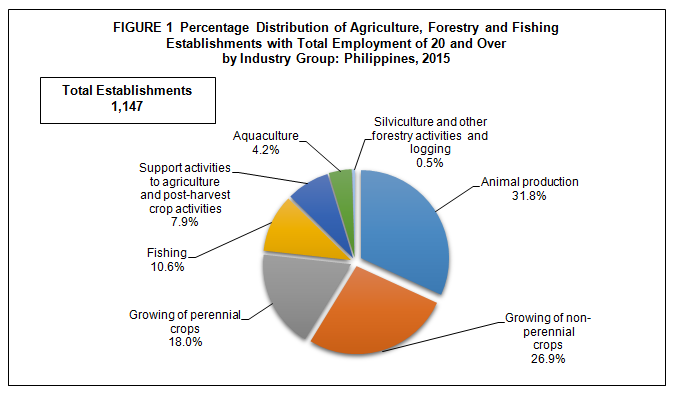
Animal production industry leads in terms of number of establishments
The preliminary results of the 2015 Annual Survey of Philippine Business and Industry (ASPBI) showed that there were 1,147 establishments with total employment (TE) of 20 and over in the formal sector engaged in agriculture, forestry and fishing activities.
Among the industries, animal production led the sector with 365 establishments, accounting for 31.8 percent of the total number of establishments. Growing of non-perennial and perennial crops followed with 309 (26.9%) and 206 (18.0%) establishments, respectively.
The remaining 23.3 percent (267 establishments) of the total were engaged in the following:
- Fishing, 122 establishments (10.6%)
- Support activities to agriculture and post-harvest crop activities, 91 establishments (7.9%)
- Aquaculture, 48 establishments (4.2%)
- Silviculture and other forestry activities and logging, 6 establishments (0.5%)
Figure 1 displays the percentage distribution of agriculture, forestry and fishing establishments with TE of 20 and over by industry group in 2015.
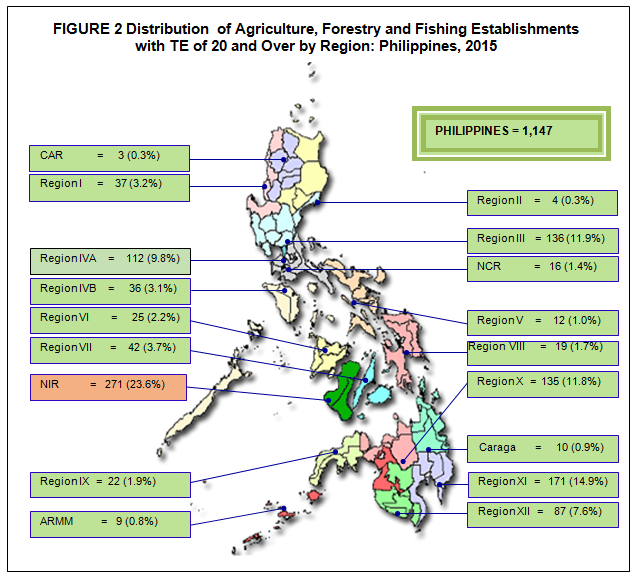
Negros Island Region registered the highest number of establishments among regions with 271 or 23.6 percent of the total. Davao followed with 171 establishments (14.9%).
The following were regions with more than a hundred number of agriculture, forestry and fishing establishments with TE of 20 and over in 2015:
- Central Luzon, 136 establishments (11.9%)
- Northern Mindanao, 135 establishments (11.8%)
- CALABARZON, 112 establishments (9.8%)
Figure 2 shows the distribution of agriculture, forestry and fishing establishments with TE of 20 and over by region in 2015.
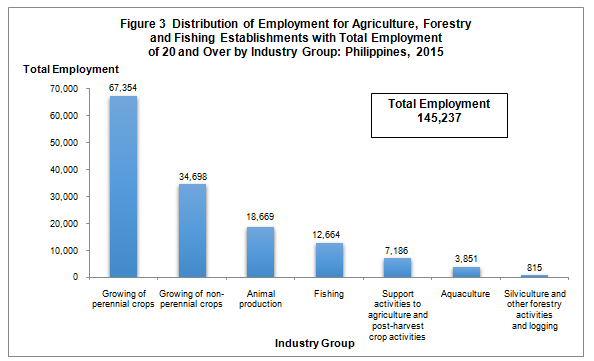
Growing of perennial crops industry generates the highest employment in 2015
Total employment generated by agriculture, forestry and fishing establishments with TE of 20 and over reached 145,237 in 2015. Of the total workforce, 143,732 workers or 99.0 percent were paid employees while the remaining 1.0 percent were working owners and unpaid workers.
Among industry groups, growing of perennial crops employed the most number of workers with 67,354 or 46.4 percent of the total. This was followed by growing of non-perennial crops and animal production with 34,698 workers (23.9%) and 18,669 workers (12.9%), respectively.
Figure 3 shows the distribution of employment for agriculture, forestry and fishing establishments with TE of 20 and over by industry group in 2015.
At the regional level, Davao which ranked second in terms of number of establishments in 2015 employed the most number of workers with 41,608 or 28.6 percent of the total. Negros Island Region followed with 28,720 workers (19.8%). Northern Mindanao came in third with 17,670 workers (12.2%).
The average number of workers per establishment for the sector was recorded at 127. Among industries, growing of perennial crops posted the highest average with 327 workers, followed by the combined industries of silviculture, other forestry industry, and logging activities with 136 workers.
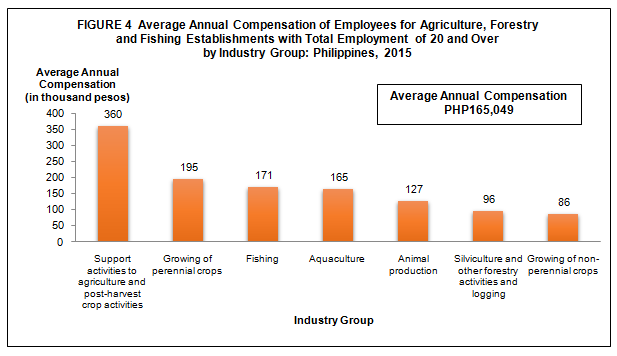
Growing of perennial crops industry pays the highest average annual compensation
Total compensation paid by the sector to its employees in 2015 amounted to PHP23.7 billion, translated to an average annual compensation of PHP165,049 per employee.
Among industries, growing of perennial crops earned the highest compensation amounting to PHP13.0 billion, more than half (55.0%) of the total. Growing of non-perennial crops followed with PHP3.0 billion (12.5%). Support activities to agriculture and post harvest crop activities placed third with PHP2.5 billion (10.7%).
Meanwhile, support activities to agriculture and post-harvest crop activities paid the highest average annual compensation at PHP360,151 per employee. Other industries paying an average annual compensation of more than a hundred thousand are:
Growing of perennial crops, PHP195,087 per employee
Fishing, PHP170,584 per employee
Aquaculture, PHP164,828 per employee
Animal production, PHP127,112 per employee
Figure 4 shows the average annual compensation of employees for agriculture, forestry and fishing establishments with total employment of 20 and over by industry group in 2015.
Across regions, the National Capital Region (NCR) paid the highest average annual compensation of PHP366,944 per employee. CARAGA and Nothern Mindanao followed with average annual compensation of PHP290,139 and PHP221,822 per employee, respectively. On the other hand, Negros Island Region paid the lowest average annual compensation of PHP67,600 per employee in 2015.
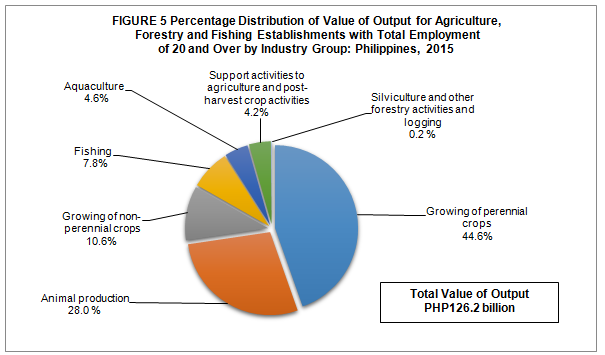
Growing of perennial crops industry generates almost half of the total value of output
Total value of output generated by agriculture, forestry and fishing establishments with TE of 20 and over reached PHP126.2 billion in 2015.
By industry group, the highest value of output was generated by growing of perennial crops worth PHP56.3 billion or 44.6 percent of the total, followed by animal production with PHP35.4 billion (28.0%).Growing of non-perennial crops ranked third with PHP13.3 billion (10.6%).
Figure 5 illustrates the percentage distribution of value of output for agriculture, forestry and fishing establishments with total employment of 20 and over by industry group in 2015.
The top three regions in terms of value of output in 2015 were are all located in Mindanao with a combined value of output of 60.5 percent of the total. Davao generated the highest value of output worth PHP32.7 billion or 25.9 percent, followed by SOCCSKSARGEN and Northern Mindanao with respective shares of 17.5 percent (PHP22.1 billion) and 17.1 percent (PHP21.6 billion).
Growing of perennial crops industry incurs the highest expense
Total expense, including compensation, for agriculture, forestry and fishing establishments with TE of 20 and over amounted to PHP127.1 billion.
Industrywise, growing of perennial crops incurred the highest expense amounting to PHP56.8 billion or 44.7 percent. Animal production ranked second with PHP33.5 billion (26.3%), followed by growing of non-perennial crops with PHP12.4 billion (9.8%).
The top three regions in terms of value of output were also the top regions in terms of value of expense, with combined shares of 58.9 percent of the total. Davao expended PHP32.8 billion (25.8%), SOCCSKSARGEN with PHP21.3 billion (16.7%) and Northern Mindanao with PHP20.8 billion (16.4%).
Income per expense ratio stands at 1.01
The sector generated an income per expense ratio of 1.01 in 2015. This means that for every peso spent, a corresponding income of PHP1.01 was generated.
Among industries, the combined income and expense of silviculture, other forestry, and logging activities recorded the highest income per expense ratio of 1.28 while support activities to agriculture and post-harvest crop activities posted the lowest income per expense ratio of 0.66.
The income per expense ratio of five other major industry groups are as follows:
Growing of non-perennial crops, 1.07
Animal production, 1.04
Growing of perennial crops, 1.03
Fishing, 1.03
Aquaculture, 1.01
Growing of perennial crops industry generates the highest value added
Total value added produced by establishments with TE of 20 and over in 2015 was estimated at PHP33.7 billion.
Among industries, growing of perennial crops generated the highest value added with PHP16.1 billion, accounting for 47.7 percent or almost half of the total value added. This was followed by animal production and growing of non-perennial crops with respective value added of PHP6.0 billion (17.7%) and PHP4.5 billion (13.4%).
At the regional level, Davao recorded the highest share to total value added with PHP9.4 billion or 27.9 percent of the total. This was followed by SOCCSKSARGEN with PHP6.2 billion (18.3 percent) and Northern Mindanao with PHP5.7 billion (16.9 percent).
Below were regions which contributed less than one percent to total value added in 2015:
Western Visayas, 0.7 percent
ARMM, 0.7 percent
Eastern Visayas, 0.4 percent
Bicol, 0.2 percent
Cagayan Valley, 0.2 percent
Cordillera Administrative Region, 0.05 percent
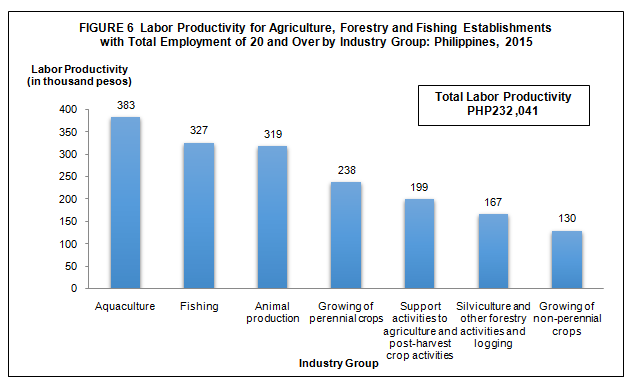
Aquaculture industry posts the highest productivity
The ratio of value added to employment, a measure of labor productivity, was recorded at PHP232,041 per worker in 2015.
Aquaculture activities generated a labor productivity of PHP382,910 per worker, the highest among industries. Fishing activities ranked second with PHP326,630 per worker while animal production recorded PHP319,173 per worker.
Figure 6 displays the labor productivity for agriculture, forestry and fishing establishments with total employment of 20 and over by industry group in 2015.
At the regional level, Central Luzon was the most labor productive in 2015, registering a labor productivity of PHP511,855. This was followed by CARAGA and SOCCSKSARGEN with respective labor productivity of PHP440,626 and PHP360,548 per worker.
Gross addition to tangible fixed assets reaches PHP7.8 billion
Gross addition to tangible fixed assets acquired by agriculture, forestry and fishing establishments was valued at PHP7.8 billion in 2015.
Among industries, growing of perennial crops contributed the highest gross addition to tangible fixed assets at PHP2.4 billion or 31.4 percent of the total. This was followed by animal production with PHP1.7 billion or 21.6 percent worth of gross addition to fixed assets.
Across the country, NCR led all regions in terms of gross addition to tangible fixed assets estimated at PHP1.9 billion or 24.9 percent share to total. This was followed by Davao with PHP1.4 billion or 18.5 percent of the total and SOCCSKSARGEN, also with approximately PHP1.4 billion or 18.1 percent of the total.
Total subsidies received in 2015 amounts to PHP3.1 billion
Subsidies granted by the government to support the business operation of agriculture, forestry and fishing establishments with TE of 20 and over in 2015 amounted to PHP3.1 billion.
Out of the eight major industry groupings for the sector, only two were recipients of subsidies in 2015. These were support activities to agriculture and post-harvest crop activities and fishing activities, both found in NCR.
TECHNICAL NOTES
Introduction
This Special Release presents the preliminary results of the 2015 ASPBI for the agriculture, forestry and fishing establishments with total employment of 20 and over.
The 2015 ASPBI is one of the designated statistical activities of the Philippine Statistics Authority (PSA). Data collected from the survey provide information on the levels, structure, performance, and trends of economic activities of the formal sector in the entire country for the year 2015.
The survey was conducted nationwide in 2016 with the year 2015 as the reference period of data, except for employment which is as of November 15, 2015.
Establishment Data Management System (EDMS) was still utilized in the decentralized processing of 2015 ASPBI questionnaires in the province as well as the online accomplishment of questionnaire through the PSA website.
Data are presented at the national and industry group or 3-digit 2009 Philippine Standard Industrial Classification (PSIC) and at the regional level.
Legal Authority
The conduct of the 2015 ASPBI is authorized under Republic Act No. 10625 known as the Philippine Statistical Act of 2013 - Reorganizing and strengthening of the Philippine Statistical System (PSS), its agencies and instrumentalities.
Scope and Coverage
The 2015 ASPBI covered establishments engaged in 18 economic sectors classified under the 2009 PSIC, namely:
- Agriculture, Forestry, and Fishing (A)
- Mining and Quarrying (B)
- Manufacturing (C)
- Electricity, Gas, Steam, and Air Conditioning Supply (D)
- Water Supply; Sewerage, Waste Management and Remediation Activities (E)
- Construction (F)
- Wholesale and Retail Trade; Repair of Motor Vehicles and Motorcycles (G)
- Transportation and Storage (H)
- Accommodation and Food Service Activities (I)
- Information and Communication (J)
- Financial and Insurance Activities (K)
- Real Estate Activities (L)
- Professional, Scientific and Technical Activities (M)
- Administrative and Support Service Activities (N)
- Education (P)
- Human Health and Social Work Activities (Q)
- Arts, Entertainment, and Recreation (R)
- Other Service Activities (S)
The following sections of the 2009 PSIC are excluded from the scope of this survey and all other establishment-based surveys of PSA:
- Public Administration and Defense; Compulsory Social Security (Section O)
- Activities of Households as Employers; Undifferentiated Goods and Services Producing Activities of Households for Own Use (Section T)
- Activities of Extra-territorial Organization and Bodies (Section U)
The survey was confined to the formal sector of the economy, which consists of the following:
- Corporations and partnership
- Cooperatives and foundations
- Single proprietorship with employment of 10 and over
- Single proprietorships with branches
Hence, the 2015 ASPBI covered only the following economic units:
- All establishments with total employment of 10 and over; and
- All establishments with total employment of less than 10, except those with Legal Organization = 1 (Single proprietorship) and Economic Organization = 1 (Single establishments), that are engaged in economic activities described according to the 2009 PSIC.
Frame of Establishments
The frame for the 2015 ASPBI was extracted from the 2015 List of Establishments (LE). The estimated number of establishments in operation in the country in 2015 totaled to 909,786. About 259,386 establishments (29.0% of the total establishments) belong to the formal sector of which 223,821 (86.3%) comprised the establishment frame. This frame was used to draw the sample establishments for the survey.
Unit of Enumeration
The unit of enumeration for the 2015 ASPBI is the establishment. An establishment is defined as an economic unit under a single ownership or control which engages in one or predominantly one kind of activity at a single fixed location.
Classification of Establishments
An establishment is categorized by its economic organization, legal organization, industrial classification, employment size, and geographic location.
Economic Organization refers to the organizational structure or role of the establishment in the organization. An establishment may be single establishment, branch, establishment and main office with branches elsewhere, main office only, and ancillary unit other than main office.
Legal Organization refers to the legal form of the economic entity which owns the establishment. An establishment may be single proprietorship, partnership, government corporation, stock corporation, non-stock corporation, and cooperative.
Industrial classification of an economic unit was determined by the activity from which it derives its major income or revenue. The 2009 PSIC was utilized to classify economic units according to their economic activities.
Size of an establishment is determined by its total employment (TE) as of a specific date.
Geographic Classification refers to the classification by geographic area using the Philippine Standard Geographic Code (PSGC) classification. The PSGC contains the latest updates on the official number of regions, provinces, cities, municipalities, and barangays in the Philippines. The PSGC as of December 31, 2015 was used for the 2015 ASPBI.
Methodology
Sampling Design
The 2015 ASPBI used stratified systematic sampling with five-digit PSIC serving as first stratification variable and TE as the second stratification variable.
For establishments with TE 20 and over, the 18 administrative regions served as the geographic domains while the 5-digit level of the 2009 PSIC served as the industry domains.
Estimation Procedure for Establishments with TE of 20 and over
- Non-Certainty Stratum (strata of TE 20 to 49 and TE 50 to 99) Sections A, C, E, F, G, H, I, K, L, M, N, P, Q, R and S
The estimate of the total of a characteristic ![]() for the non-certainty employment strata in an industry domain in each region,
for the non-certainty employment strata in an industry domain in each region,

where:
s denotes the non-certainty employment strata in TE of 20 to 49 and TE 50 to 99
p = 1, 2,..., 17 regions (geographic domains)
xspj = value of the jth establishment in the non-certainty employment strata in TE of 20 and over for an industry domain in each region
j = 1, 2, 3,…, nsp establishments
![]() = weight of the jth establishment in the non-certainty employment strata in TE of 20 and over for an industry domain in each region
= weight of the jth establishment in the non-certainty employment strata in TE of 20 and over for an industry domain in each region

Nsp = total number of establishments in the non-certainty employment strata in TE of 20 and over for an industry domain in each region
nsp = number of sample establishments in the non-certainty employment strata in TE of 20 and over for an industry domain in each region
- Certainty Stratum (TE 100 and over) (Establishments under the following: Section B, D and J, ICT core industries, BPM industries, GOCCs and with TE 100 and over)
The total of a characteristic ![]() for the certainty employment stratum in an industry domain in each region was
for the certainty employment stratum in an industry domain in each region was

where:
c denotes the certainty employment strata in TE of 20 and over
p = 1, 2,..., 17 regions (geographic domains)
xcpj = value of the jth establishment in the certainty employment strata in TE of 20 and over in an industry domain within each region
j = 1, 2, 3, …, mcp establishments
mcp = number of establishments in the certainty employment strata in TE of 20 and over in an industry domain within each region
- Total Estimate for TE of 20 and Over
The estimate of the total of a characteristic ![]() for the industry domain in each region (geographic domain) was obtained by aggregating the estimates for all employment strata (non-certainty and certainty) in the same industry domain,
for the industry domain in each region (geographic domain) was obtained by aggregating the estimates for all employment strata (non-certainty and certainty) in the same industry domain,

where dp denotes the industry domains in each region.
National level estimates of the characteristics by industry domain were obtained by aggregating separately the estimates ![]() for the particular industry domain from all the regions.
for the particular industry domain from all the regions.
Weight Adjustment Factor for Non-Response
To account for non-response in the non-certainty strata, the adjustment factor (n/n’) was multiplied with the sampling weight (W) of each of the sampling unit. The sampling weight, defined as N/n, was recomputed as

Thus, the adjusted weight (W’spj) for the non-certainty employment stratum for the industry domain with TE 20-99 was

where:
Nsp = total number of establishments in the non-certainty employment stratum with TE 20-99 for the industry domain within each geographic domain (region)
n’sp = number of responding establishments in the non-certainty employment stratum with TE 20-99 for the industry domain within each geographic domain (region)
Response Rate
Response rate for Agriculture, Forestry and Fishing Sector for establishments with TE of 20 and over was 94.9 percent (728 out of 767 establishments). This included receipts of "good" questionnaires, partially accomplished questionnaires, reports of closed, moved out or out of scope establishments.
Of the total responses, 15 establishments responded online
Reports of the remaining non-reporting establishments were imputed based on established imputation methods and from other available administrative data sources and financial statements from Securities and Exchange Commission (SEC). However, reports of establishments which were found to be duplicates and out of business in 2015, were not imputed.
Limitation of Data
The 2015 ASPBI covered only the formal sector of the economy.
Concepts and Definitions of Terms
Economic activity is the establishment’s source of income. If the establishment is engaged in several activities, its main economic activity is that which earns the biggest income or revenue.
Total employment is the number of persons who worked in for the establishment as of November 15, 2015.
Paid employees are all persons working in the establishment and receiving pay, as well as those working away from the establishment paid by and under the control of the establishment. Included are all employees on sick leave, paid vacation or holiday. Excluded are consultants, home workers, receiving pure commissions only, and workers on indefinite leave.
Compensation is the sum of salaries and wages, separation/retirement/terminal pay, gratuities, and payments made by the employer in behalf of the employees such as contribution to SSS/GSIS, ECC, PhilHealth, Pag-ibig, etc.
Salaries and wages are payments in cash or in kind to all employees, prior to deductions for employee’s contributions to SSS/GSIS, withholding tax, etc. Included are total basic pay, overtime pay and other benefits.
Income or Revenue refers to cash received and receivables for goods/products and by-products sold and services rendered.
E-commerce refers to the selling of products or services over electronic systems such as Internet Protocol-based networks and other computer networks. Electronic Data Interchange (EDI) network, or other on-line system. Excluded are orders received from telephone, facsimile and e-mails.
Expense refers to cost incurred in an enterprise effort to generate revenue, representing the cost of doing business. This is treated on a consumed basis. It excludes cost incurred in the acquisition of income generating assets.
Intermediate expense are expenditures incurred in the production of goods such as materials and supplies used, fuels, lubricants, oils and greases used; electricity and water purchased, agricultural/forestry/fishery and industrial services done by others.
Value added is gross output less intermediate input. Gross output for the agriculture, forestry and fishing sector is value of output non-industrial services done for others (except rent income from land). Intermediate input is intermediate expenses plus non-industrial services done by others (except rent expense for land) and all other expenses.
Value of output represents the sum of the receipts from products and by-products sold, agricultural/forestry/fishery services rendered, industrial services, and goods sold in the same condition as purchased less the cost of goods sold; and value of fixed assets produced on own account and change in inventories of finished products and work-in-progress.
Gross addition to tangible fixed assets is equal to capital expenditures less sale of fixed assets, including land.
Change in inventories is equivalent to the value of inventories at the end of the year less the value of inventories at the beginning of the year.
Inventories refer to the stock of goods owned by and under the control of the establishment as of a fixed date, regardless of where the stocks are located. Valuation is at current replacement cost in purchaser prices. Replacement cost is the cost of an item in terms of its present price rather than its original cost.
Subsidies are all special grants in the form of financial assistance or tax exemption or tax privilege given by the government to aid and develop an industry.