Release Date :
Reference Number :
2013-120
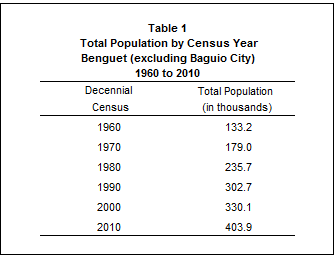
Population of Benguet (excluding Baguio City) increased at the rate of 2.04 percent annually
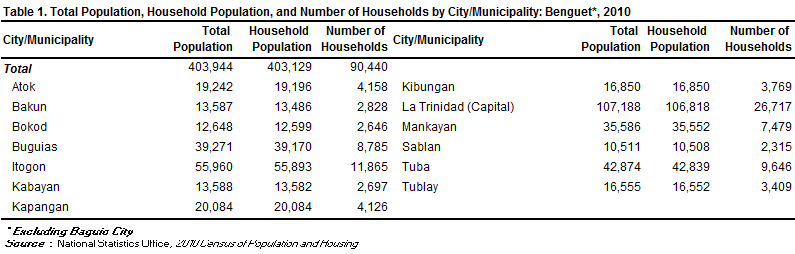
Based on the 2010 Census of Population and Housing (CPH), the province of Benguet, excluding Baguio City, posted a total population of 403,944 persons as of May 1, 2010. This is larger by 73,815 persons compared to its total population of 330,129 persons counted in the 2000 CPH. The increase in the population count from 2000 to 2010 translated to an average annual population growth rate (PGR) of 2.04 percent. This is higher than the 0.87 percent annual PGR of the province between the census years 1990 and 2000.
If the average annual PGR recorded at 2.04 percent during the period 2000 to 2010 continues, the population of Benguet would double in 34 years.
Fifty years ago, the population of Benguet was only 133,221 persons. This population size is one third of the population of the province in the 2010 CPH.
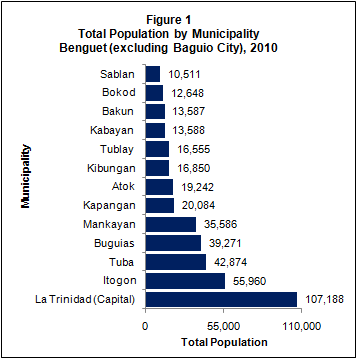
La Trinidad was the most populous municipality
Among the lone city and 12 municipalities of Benguet, the municipality of La Trinidad, the provincial capital, was the most populous with a population size making up 26.5 percent of the total provincial population. The municipality of Itogon was second with 13.9 percent share, followed by the municipalities of Tuba with 10.6 percent, Buguias with 9.7 percent, and Mankayan with 8.8 percent. The rest of the municipalities contributed less than 8.0 percent each.
The least populated area was the municipality of Sablan with 2.6 percent share to the total population of the province. It was also the least populated municipality in 2000.
Sex ratio was 107 males per 100 females
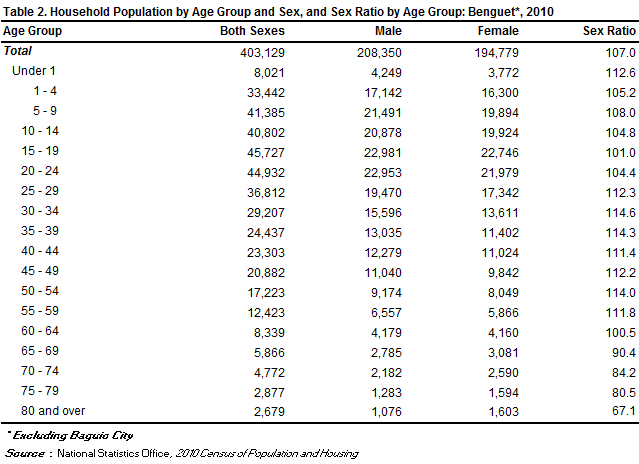
Of the 403,129 household population in 2010, males accounted for 51.7 percent while females comprised 48.3 percent. These figures resulted in a sex ratio of 107 males for every 100 females. In 2000, the recorded sex ratio was the same as that in 2010.
Median age increased to 23.6 years
In 2010, the median age of the population of the province was 23.6 years, which means that half of the population was younger than 23.6 years. This is higher than the median age of 20.2 years that was recorded in 2000.
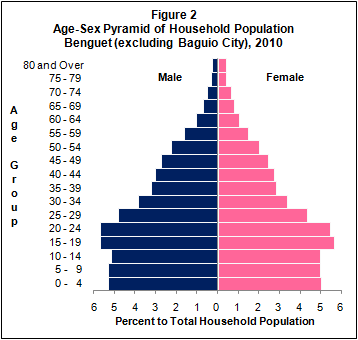
Moreover, 30.7 percent of the household population were under 15 years old. Persons aged 15 to 19 years (11.3 percent) comprised the largest age group, followed by those in the age groups 20 to 24 years (11.1 percent) and 0 to 4 years and 5 to 9 years (10.3 percent each). Males outnumbered females in the age groups 0 to 64 years. On the other hand, there were more females than males in the older age groups (65 years and over).
More than three fifths of the population were of voting age
The voting-age population (18 years and over) accounted for 62.8 percent of the household population of the province in 2010, up from 54.7 percent in 2000. There were more males (51.9 percent) than females (48.1 percent) among the voting-age population.
Dependency ratio decreased to 53 dependents per 100 persons in the working age group
In 2010, the young dependents (0 to 14 years) comprised 30.7 percent of the household population while the old dependents (65 years and over) posted a share of 4.0 percent. The working-age population (15 to 64 years) accounted for the remaining 65.3 percent.
The overall dependency ratio was 53, which indicates that for every 100 working-age population, there were about 53 dependents (47 young dependents and six old dependents). This ratio is lower than the dependency ratio in 2000, which was recorded at 72 dependents per 100 working-age population (66 young dependents and six old dependents).
There were more males than females among the never-married persons
Of the household population 10 years old and over, 48.0 percent were never married while 46.4 percent were married. The rest of the population were categorized as follows: widowed (3.7 percent), in common-law/live-in marital arrangement (1.1 percent), and divorced/separated (0.8 percent).
Males outnumbered the females among the never-married and married persons as they comprised 55.7 percent of all the never-married persons and 50.1 percent of all the married persons. For the rest of the categories for marital status, the females outnumbered the males.
More females had attained higher levels of education
Of the household population aged five years and over, 33.6 percent had attended or completed elementary education, 31.9 percent had reached or finished high school, 12.2 percent were college undergraduates, and 12.0 percent were academic degree holders. Among those with an academic degree, the females (62.6 percent) outnumbered the males (37.4 percent). Similarly, more females (58.8 percent) than males (41.2 percent) had pursued post baccalaureate courses.
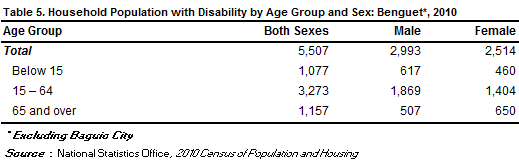
Persons with disability comprised 1.4 percent of the population in the province
In 2010, around 5,500 persons or 1.4 percent of the 403,129 household population had a disability. The proportion of persons with disability (PWD) in 2000 was 1.1 percent of the 329,216 household population of the province during that year. The number of PWD for the same year was around 3,600.
There were more females than males among those with functional difficulty
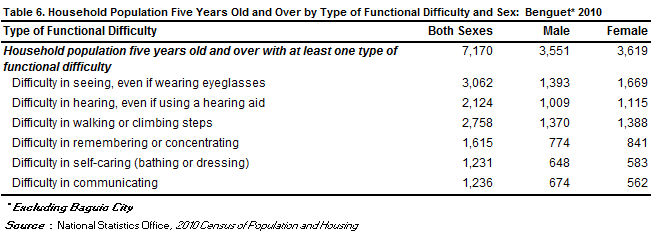
Of the 361,666 household population five years and over, 2.0 percent (or 7,170 persons) had at least one type of functional difficulty either in seeing, hearing, walking or climbing steps, remembering or concentrating, self-caring (bathing or dressing), or communicating. There were more females (50.5 percent) than males (49.5 percent) among those persons with at least one type of functional difficulty.
Moreover, of the total 7,170 persons aged five years and over with at least one type of functional difficulty, 42.7 percent reported difficulty in seeing, even if wearing eyeglasses. There were 38.5 percent who had difficulty in walking or climbing step; 29.6 percent had difficulty in hearing, even if using a hearing aid; 22.5 percent had difficulty in remembering or concentrating; 17.2 percent had difficulty in communicating; and another 17.2 percent had difficulty in self-caring (bathing or dressing).
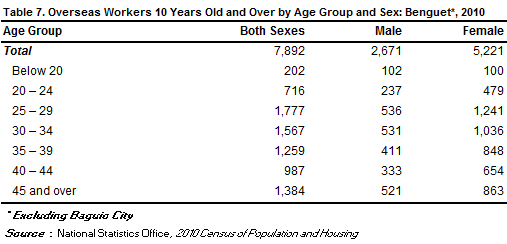
Female overseas workers outnumbered their male counterparts
Of the 320,281 household population 10 years old and over in Benguet, 2.5 percent (or 7,892 persons) were overseas workers. Female overseas workers outnumbered their male counterparts as they comprised 66.2 percent of all the overseas workers from this province. Overseas workers aged 25 to 29 years made up the largest age group, comprising 22.5 percent of the total overseas workers from this province in 2010, followed by the age groups 30 to 34 years (19.9 percent), 45 years and over (17.5 percent), and 35 to 39 years (16.0 percent).

Average household size was 4.5 persons
The number of households in 2010 was recorded at 90,400, higher by 27,317 households compared with the 63,123 households posted in 2000. The average household size in 2010 was 4.5 persons, lower than the average household size of 5.2 persons in 2000.
There were 101 households per 100 occupied housing units
A total of 89,265 occupied housing units were recorded in the province of Benguet in 2010. This translates to a ratio of 101 households for every 100 occupied housing units, with 4.5 persons per occupied housing unit. In 2000, there were 101 households per 100 occupied housing units and 5.3 persons per occupied housing unit.
Occupied housing units with outer walls and roofs made of strong materials increased
In 2010, 41.1 percent of the occupied housing units in the province had outer walls made of concrete/brick/stone, higher than the proportion of 20.2 percent recorded in 2000. The proportion of occupied housing units with outer walls made of galvanized iron/aluminum decreased from 46.1 percent in 2000 to 37.0 percent in 2010. Meanwhile, most of the occupied housing units (92.0 percent) in 2010 had roofs made of galvanized iron/aluminum, higher than the proportion of 89.6 percent recorded in 2000.
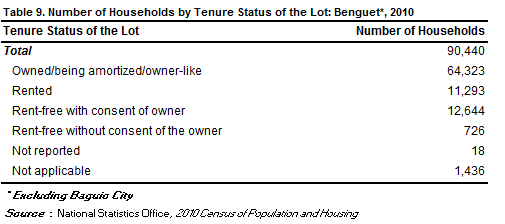
Three in every 10 households lived in lots that they owned or amortized
In 2010, of the total 90,440 households, 71.1 percent owned or amortized the lots that they occupied. The corresponding figure in 2000 was 73.3 percent.
Moreover, 14.0 percent of the households occupied lots which were rent-free but with consent of the owner, 12.5 percent rented the lots that they occupied while 0.8 percent occupied lots which were rent-free but without consent of the owner.
(Sgd) CARMELITA N. ERICTA
Administrator