Release Date :
Reference Number :
2013-128
Population of Camiguin increased at the rate of 1.22 percent annually
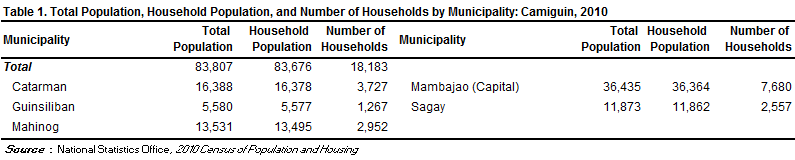
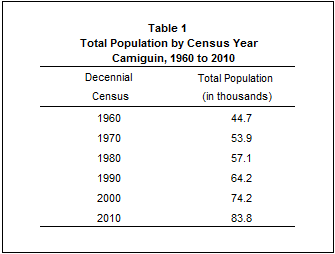
Based on the 2010 Census of Population and Housing (CPH), the province of Camiguin posted a total population of 83,807 persons as of May 1,2010. This is larger by 9,575 persons compard to its total population of 74,232 persons counted in the 2000 CPH. The increase in the population count from 2000 to 2010 translated to an average annual population growth rate (PGR) of 1.22 percent. This is lower than the 1.45 percent annual PGR of the province between the census years 1990 and 2000.
If the average annual PGR recorded at 1.22 percent during the period 2000 to 2010 continues, the population of Camiguin would double in 57 years.
Fifty years ago, the population of Camiguin was only 44,717 persons. This population size is about one sixth of the total population of the province in the 2010 CPH.
Mambajao was the most populated municipality
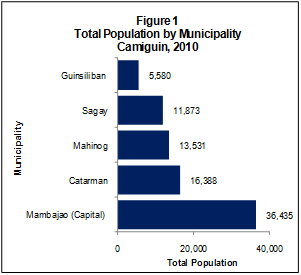
Of the five municipalities comprising the province of Camiguin, Mambajao, the provincial capital, was the most populated with a share of 43.5 percent of the total provincial population in 2010.
The municipality of Catarman came in second with 19.6 percent share. This was followed by the municipalities of Mahinog with 16.1 percent, Sagay with 14.2 percent, and Guinsiliban with 6.7 percent.
The municipality of Guinsiliban was the least populated in 2000.
Sex ratio remained at 104 males per 100 females
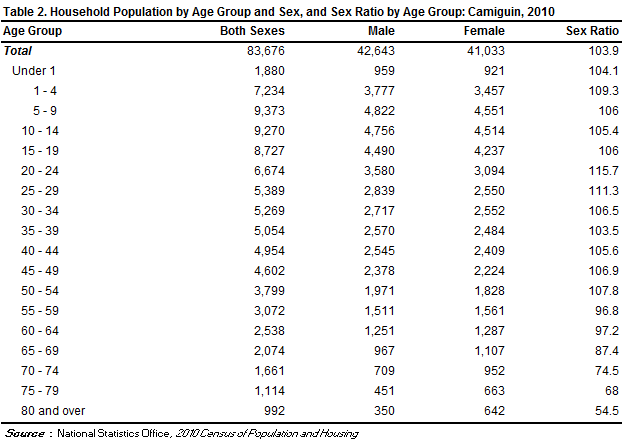
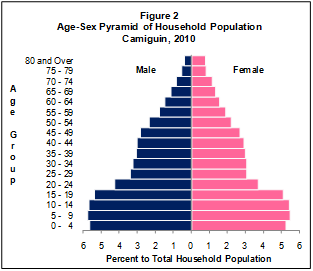
Of the 83,676 household population in 2010, males accounted for 51.0 percent while females comprised 49.0 percent. These figures resulted in a sex ratio of 104 males for every 100 females, which is the same as the sex ratio recorded in 2000.
Median age increased to 24.0 years
In 2010, the median age of the population of the province was 24.0 years, which means that half of the population was younger than 24.0 years. This is higher than the median age of 21.9 years that was recorded in 2000.
Moreover, 33.2 percent of the household population were under 15 years old. Children aged 5 to 9 years (11.2 percent) comprised the largest age group, followed by those in the age groups 10 to 14 years (11.1 percent) and 0 to 4 years (10.9 percent). Males outnumbered females in the age groups 0 to 54 years. On the other hand, there were more females than males in the older age groups (55 years and over).
Three fifths of the population were of voting age
The voting-age population (18 years and over) accounted for 60.4 percent of the household population of the province in 2010, up from 56.6 percent in 2000. There were more males (50.6 percent) than females (49.4 percent) among the voting-age population.
Dependency ratio decreased to 67 dependents per 100 persons in the working age group
In 2010, the young dependents (0 to 14 years) comprised 33.2 percent of the household population while the old dependents (65 years and over) posted a share of 7.0 percent. The working-age population (15 to 64 years) accounted for the remaining 59.8 percent.
The overall dependency ratio was 67, which indicates that for every 100 working-age population, there were about 67 dependents (55 young dependents and 12 old dependents). This ratio is lower than the dependency ratio in 2000, which was recorded at 76 dependents (65 young dependents and 11 old dependents) per 100 working-age population.
There were more males than females among the never-married persons
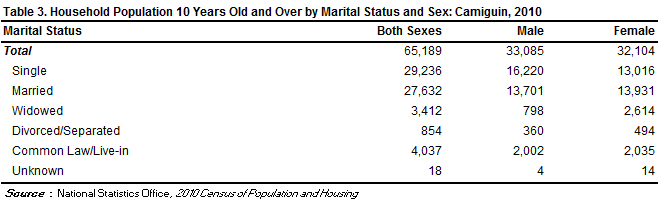
Of the household population 10 years old and over, 44.8 percent were never married while 42.4 percent were married. The rest of the population were categorized as follows: in common-law/live-in marital arrangement (6.2 percent), widowed (5.2 percent), and divorced/separated (1.3 percent).
Among the never-married persons, 55.5 percent were males while 44.5 percent were females. For the rest of the categories for marital status, the females outnumbered the males.
More females had attained higher levels of education
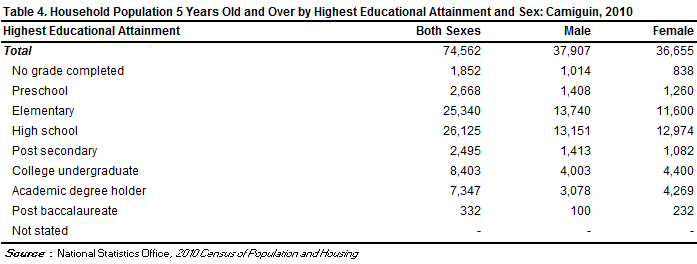
Of the household population aged five years and over, 34.0 percent had attended or completed elementary education, 35.0 percent had reached or finished high school, 11.3 percent were college undergraduates, and 9.9 percent were academic degree holders. Among those with an academic degree, the females (58.1 percent) outnumbered the males (41.9 percent). Likewise, more females (69.9 percent) than males (30.1 percent) had pursued post baccalaureate courses.
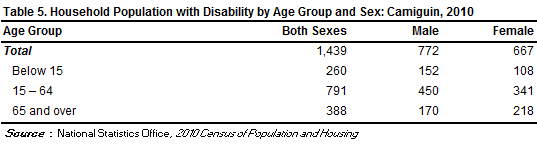
Persons with disability comprised 1.7 percent of the population in the province
In 2010, around 1,400 persons or 1.7 percent of the 83,676 household population had a disability. This proportion of persons with disability (PWD) is higher than the proportion in 2000, which was 1.4 percent of the 74,134 household population of the province during that year. The number of PWD for the same year was around 1,000
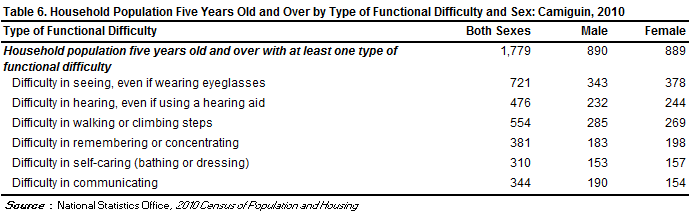
There was an equal distribution of males and females among those with functional difficulty
Of the 74,562 household population five years and over, 2.4 percent (or 1,779 persons) had at least one type of functional difficulty either in seeing, hearing, walking or climbing steps, remembering or concentrating, self-caring (bathing or dressing), or communicating. Males and females had an equal distribution of 50.0 percent each among those persons with at least one type of functional difficulty.
Moreover, of the total 1,779 persons aged five years and over with at least one type of functional difficulty, 40.5 percent reported difficulty in seeing, even if wearing eyeglasses. There were 31.1 percent who had difficulty in walking or climbing steps; 26.8 percent had difficulty in hearing, even if using a hearing aid; 21.4 percent had difficulty in remembering or concentrating; 19.3 percent had difficulty in communicating; and 17.4 percent had difficulty in self-caring (bathing or dressing).
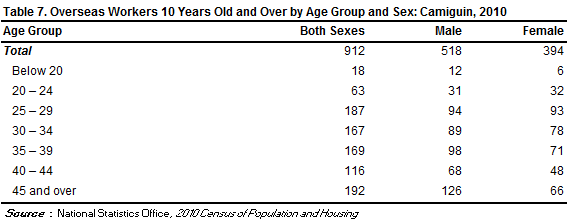
Male overseas workers outnumbered their female counterparts
Of the 65,189 household population 10 years old and over in Camiguin, 1.4 percent (or 912 persons) were overseas workers. Male overseas workers outnumbered their female counterparts as they comprised 56.8 percent of all the overseas workers from this province. Overseas workers aged 45 years and over made up the largest age group, comprising 21.1 percent of the total overseas workers from this province in 2010, followed by the age group 25 to 29 years (20.5 percent), 35 to 39 years (18.5 percent), and 30 to 34 years (18.3 percent).
Average household size decreased to 4.6 persons
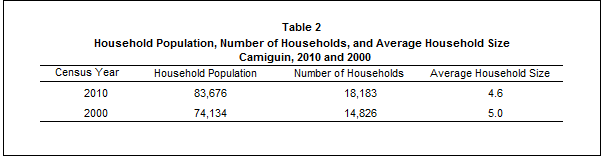
The number of households in 2010 was recorded at 18,183, higher by 3,357 households compared with the 14,826 households posted in 2000. The average household size in 2010 was 4.6 persons, lower than the average household size of 5.0 persons in 2000.
There were 100 households per 100 occupied housing units
A total of 18,177 occupied housing units were recorded in the province of Camiguin in 2010. This translates to a ratio of 100 households for every 100 occupied housing units, with 4.6 persons per occupied housing unit. In 2000, there were 101 households per 100 occupied housing units, and 5.0 persons per occupied housing unit.
Occupied housing units with outer walls made of light materials decreased
In 2010, 34.5 percent of the occupied housing units in the province had outer walls made of concrete/brick/stone, higher than the 19.6 percent recorded in 2000. The proportion of occupied housing units with outer walls made of wood decreased from 38.2 percent in 2000 to 25.7 percent in 2010. Meanwhile, four in every five occupied housing units (84.6 percent) in 2010 had roofs made of galvanized iron/aluminum, up from 75.0 percent recorded in 2000. The proportion of occupied housing units with roofs made of cogon/nipa/anahaw decreased from 21.7 percent in 2000 to 10.7 percent in 2010.
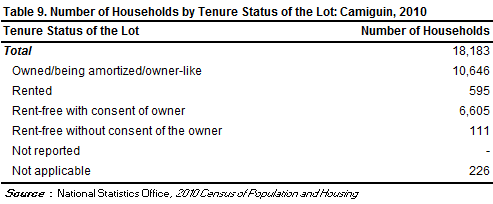
More than half of the households lived in lots that they owned or amortized
In 2010, of the total 18,183 households, majority (58.5 percent) owned or amortized the lots that they occupied. The corresponding figure in 2000 was 50.7 percent.
Moreover, 36.3 percent of the households occupied lots which were rent-free but with consent of the owner, 3.3 percent rented the lots that they occupied while 0.6 percent occupied lots which were rent-free but without consent of the owner.
(Sgd) CARMELITA N. ERICTA
Administrator