Release Date :
Reference Number :
2020-037

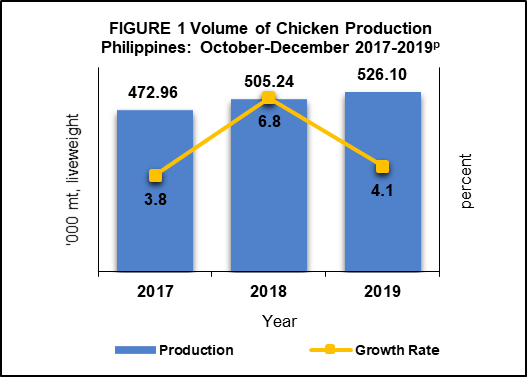
The October to December 2019 total chicken production of 526.10 thousand metric tons, liveweight,  increased  by 4.1 percent from the 2018 output of 505.24 thousand metric tons, liveweight.

Relative to their levels in 2018, 12 regions registered increases in chicken production during the period. In terms of growth rate, Central Luzon posted the highest growth of 8.5 percent, from 174.62 thousand metric tons, liveweight in 2018 to 189.39 thousand metric tons, liveweight in 2019.

Among the regions, Central Luzon was the highest producer of chicken. This was followed by CALABARZON and Northern Mindanao with corresponding production levels of 98.39 thousand metric tons, liveweight and 52.23 metric tons, liveweight. These three regions contributed 64.6 percent to the country’s total chicken production. (Table 1)


Figure 1


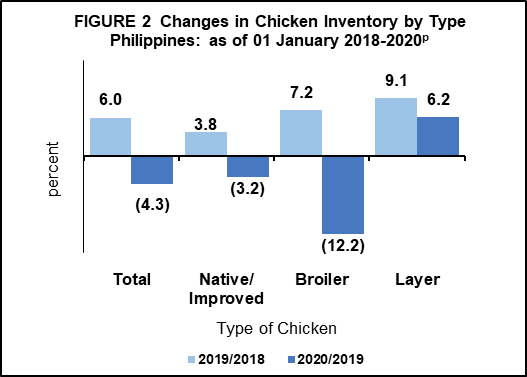
As of 01 January 2020, the total inventory of chicken was estimated at 178.26 million birds. The inventory of native/improved chicken dropped by 3.2 percent, from 83.34 million birds in 2019 to 80.68 million birds in 2020. Broiler chicken inventory at 56.39 million birds significantly went down by 12.2 percent from its previous year’s level of 64.22 million birds. Layer chicken inventory was recorded at 41.20 million birds or 6.2 percent higher than the previous year’s record of 38.81 million birds.

Among the regions, the highest inventory of native/improved chicken of 12.45 million birds or 15.4 percent of the total native/improved chicken inventory was recorded in Western Visayas. Broiler chicken inventory was highest in Central Luzon at 13.79 million birds or 24.5 percent of the total broiler chicken inventory. Meanwhile, CALABARZON shared the highest inventory of layer chicken of 14.69 million birds or 35.7 percent of the total layer chicken inventory. (Table 2)


Figure 2


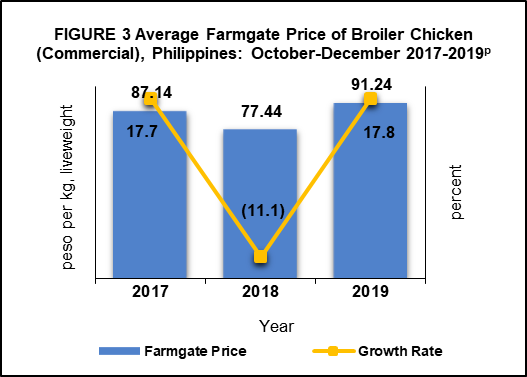
The average farmgate price of broiler chicken in commercial farms in October to December 2019 was PhP91.24 per kilogram, liveweight. This was 17.8 percent higher than the previous year’s average price of PhP77.44 per kilogram, liveweight.

During the period, the highest farmgate price was recorded in October at PhP98.98 per kilogram, liveweight, while the lowest    was quoted in December at PhP86.57 per kilogram, liveweight. (Table 3)


Figure 3


TECHNICAL NOTES

This Chicken Situation Report presents the chicken industry in terms of volume of production, inventory by type, and average farmgate price. The report was prepared to serve as ready reference for PSA’s various clients and stakeholders in the agriculture sector. It is released quarterly in January, May, August and November every year.

Concepts and Definitions

Volume of production refers to the volume of locally-raised chicken disposed for dressing including those which were shipped out to other regions/provinces for dressing. This is expressed in metric tons, liveweight.
Inventory refers to the actual number of chicken present in the farm as of a specific reference date.
Farmgate price refers to the price received by raisers for their produce at the location of farm. Thus, marketing costs such as transport and other marketing cost (if any) incurred in selling the produce are not included in the farmgate prices.


ROSALINDA P. BAUTISTA
Assistant Secretary
Deputy National Statistician
Sectoral Statistics Office


Related Contents

Chicken Situation Report, January to March 2023

In January to March 2023, chicken production was estimated at liveweight, indicating an annual growth of from the liveweight output in the same period of 2022. (Figure 1) During the period,…

Chicken Situation Report, October-December 2022

Total chicken production from October to December 2022 reached  liveweight, indicating an annual growth of  from the  liveweight output in the same quarter of the previous year. This is a recovery…

Chicken Situation Report, July-September 2022

The country’s total chicken production increased to liveweight in the third quarter of 2022, from liveweight in the same quarter of the previous year. This translates to an annual growth rate of a…