
Commodity flow or domestic trade refers to the flow of commodities through the water, air and rail transport systems in the country. Data on the inflow and outflow of commodities in the different regions of the country are used to construct interregional and inter-industry relation tables. These serve as bases in the formulation and implementation of various regional development programs like countryside development and port planning.
Quantity of domestic trade falls, value increases
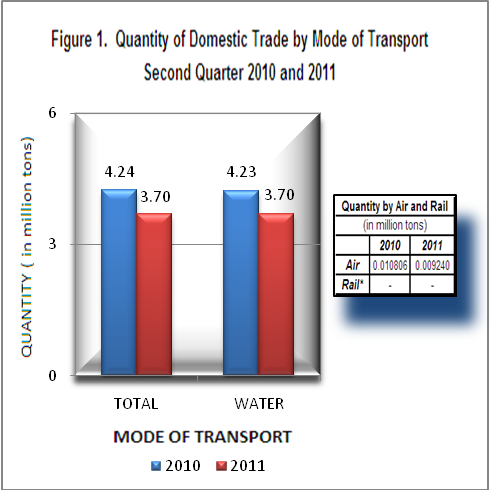
The total quantity of domestic trade transactions in the second quarter of 2011 decreased by 12.6 percent, resulting to 3.70 million tons from 4.24 million tons reported during the same period of last year. The commodities were traded mostly through water comprising 99.7 percent and 99.8 percent recorded in the second quarter of 2010 and 2011, respectively.
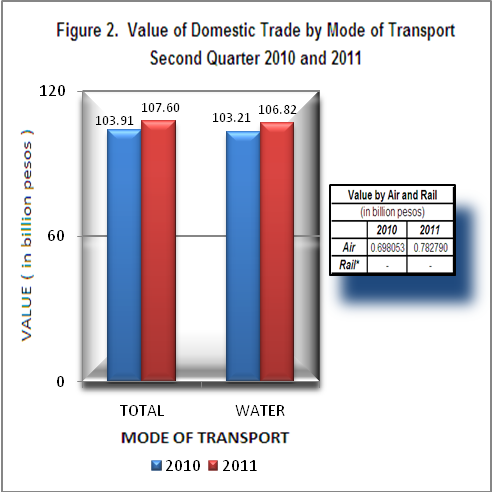
On the other hand, the total value of commodity flow within the country increased by 3.6 percent from PhP103.91 billion in the second quarter of 2010 to PhP107.60 billion in the same period of 2011. Trade transactions through water transport accounted for 99.3 percent, the same percentage recorded in the second quarter of 2010.
Food and live animals dominates total domestic trade value
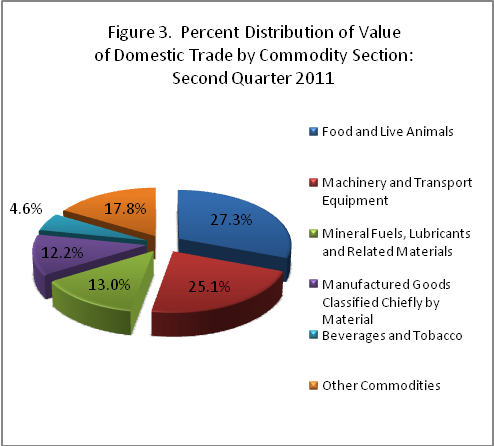
Food and live animals contributed the largest share among the commodities transacted throughout the country in the second quarter of 2011, with value amounting to PhP29.38 billion (27.3%). This was followed by machinery and transport equipment with PhP27.00 billion (25.1%) while mineral fuels, lubricants and related materials contributed PhP14.04 billion (13.0%). Animal and vegetable oils, fats and waxes had the least share of PhP1.37 billion (1.3%). (Table 1)
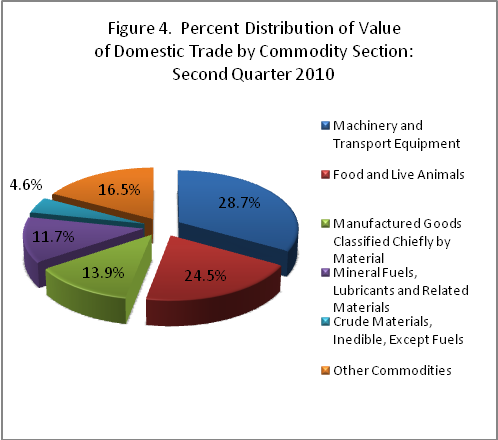
Machinery and transport equipment dominated the domestic trade in the second quarter of 2010, with a share of 28.7 percent (PhP29.86 billion) of the total value. This was followed by food and live animals with 24.5% percent share (PhP25.48 billion), manufactured goods classified chiefly by material with a share of 13.9% (PhP14.45 billion). Contributing the least share of PhP1.68 billion (1.6%) was animal and vegetable oils, fats and waxes. (See Table 1)
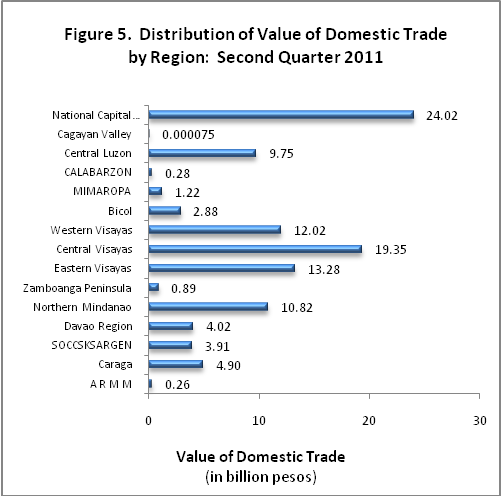
National Capital Region (NCR) accounts for the largest value of domestic trade
In the second quarter of 2011, most of the traded commodities came from National Capital Region with value of domestic trade amounting to PhP24.02 billion (22.3%). Central Visayas was the second with PhP19.35 billion (18.0%). Eastern Visayas was next with PhP13.28 billion (12.3%), followed by Western Visayas with PhP12.02 billion (11.2%). Cagayan Valley�s domestic trade contributed the least share among the regions with only PhP75 thousand.
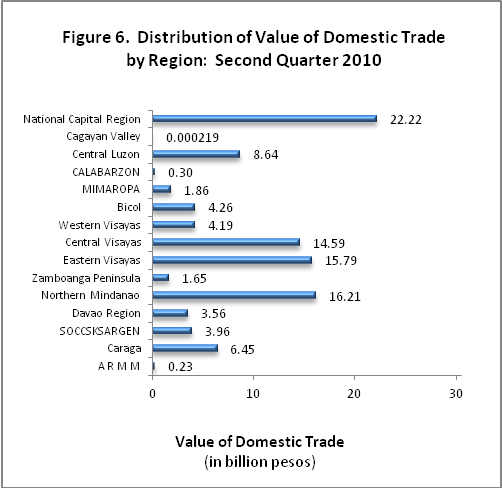
Likewise, NCR had the highest domestic trade share at PhP22.22 billion (21.4%) during the second quarter of 2010. Northern Mindanao was the second with PhP16.21 billion (15.6%). Eastern Visayas was next with PhP15.79 billion (15.2%), followed by Central Visayas with PhP14.59 billion (14.0%). Cagayan Valley contributed the least share among the regions with only PhP219 thousand.
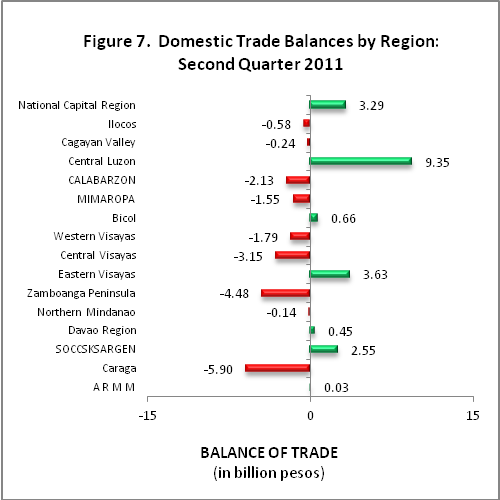
Central Luzon leads in favorable trade balance
In the Second quarter of 2011, Central Luzon posted the most favorable trade balance at PhP9.35 billion. Other regions which surpassed the billion positive trade balance were Eastern Visayas (PhP3.63 billion), NCR (PhP3.29 billion), and SOCCSKSARGEN (PhP2.55 billion). On the other hand, Caraga suffered an unfavorable trade balance of negative PhP5.90 billion. Other regions with more than a billion negative trade balances were Zamboanga Peninsula (PhP4.48 billion), Central Visayas (PhP3.15 billion), CALABARZON (PhP2.13 billion), Western Visayas (PhP1.79 billion) and MIMAROPA (PhP 1.55 billion).
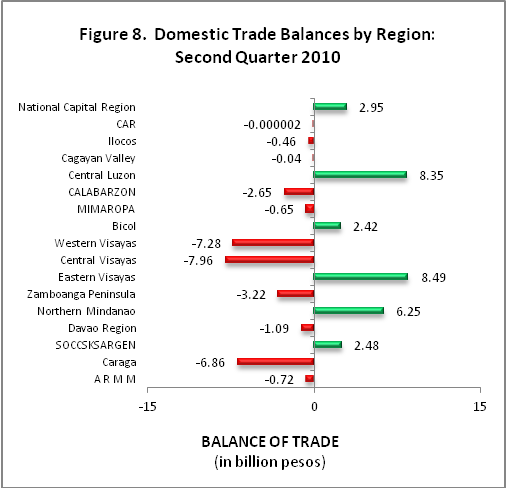
For the same period in 2010, Eastern Visayas posted the most favorable balance of trade at PhP8.49 billion. Other regions which surpassed the billion positive trade balance were Central Luzon (PhP8.35 billion), Northern Mindanao (PhP6.25 billion), NCR (PhP2.95 billion), SOCCSKSARGEN (PhP2.48 billion) and Bicol (PhP2.42 billion). On the other hand, Central Visayas suffered an unfavorable trade balance of negative PhP7.96 billion.
Notes:
- DOMSTAT reports from the following provinces/cities were not yet received as of September 13, 2011, and were not included in this special release:
- Occidental Mindoro - Coastwise (April to June 2011)
- Romblon - Coastwise (May & June 2011)
- Negros Occidental - Coastwise (June 2011)
- Isabela City, Basilan - Coastwise (May & June 2011)
- Zamboanga Del Sur (Pagadian City) - Coastwise (April to June 2011)
- Agusan Del Norte - Coastwise (June 2011)
- Surigao Del Sur - Coastwise (April to June 2011)
- Sulu - Coastwise (April to June 2011)
- Tawi Tawi - Coastwise (May & June 2011)
- Philippine National Railways (PNR) has not resumed its operation.
Source: National Statistics Office
Manila, Philippines