
DECEMBER 2019
YEAR-ON-YEAR
Philippines
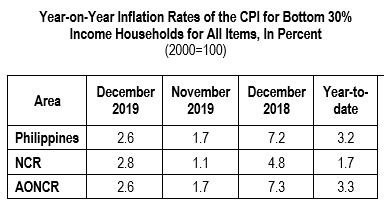
The year-on-year inflation for the bottom 30% income households at the national level picked up further by 2.6 percent in December 2019.
In the previous month, the annual growth rate was observed at 1.7 percent, while in December 2018, it was posted at 7.2 percent.
Relative to their annual growth rates in November 2019, annual mark-ups were higher in the indices of food, beverages and tobacco (FBT) at 2.5 percent; fuel, light and water (FLW), 3.2 percent; and services, 3.1 percent. On the other hand, slower annual increments were registered in the indices of clothing and miscellaneous at 2.8 percent and 2.2 percent, respectively. The index of housing and repairs (H&R) retained its previous month’s annual rate of 3.7 percent. (Tables 3 and 4)
The annual average inflation for the bottom 30% income households at the country level for the year 2019 decelerated to 3.2 percent from 7.2 percent in 2018.
Compared with their 2018 annual average inflation, the annual average increases in 2019 slowed down in the indices of FBT at 3.4 percent; H&R, 4.1 percent; and FLW, 2.0 percent. On the contrary, higher annual average inflation were noted in the indices of clothing at 3.0 percent; services, 3.4 percent; and miscellaneous, 2.3 percent. (Tables 3 and 4A)
The annual change of the country’s food index climbed further to 1.3 percent in December 2019. Its annual rate of increase was 0.4 percent in November 2019, and 7.1 percent in December 2018. (Tables 5 and 7)
The following food groups recorded higher annual increments during the month:
- Corn, 0.9 percent;
- Eggs, 6.4 percent;
- Fish, 6.9 percent;
- Fruits and vegetables, 7.5 percent;
- Meat, 1.0 percent; and
- Miscellaneous foods, 2.7 percent.
On the other hand, the dairy products index registered a slower annual gain of 1.4 percent during the month. Moreover, the index of rice continued to move downward with an annual rate of -5.4 percent. The annual increment of cereal preparations index remained at 2.1 percent. (Table 5)
| Year-on-Year Inflation Rates of the CPI for Bottom 30% Income Households in the Philippines for All Items, In Percent January 2015 – December 2019 (2000=100) | |||||
|---|---|---|---|---|---|
| Month | Year | ||||
| 2015 | 2016 | 2017 | 2018 | 2019 | |
| January | 3.8 | 1.0 | 2.4 | 4.7 | 5.9 |
| February | 2.9 | 1.0 | 3.0 | 5.4 | 5.0 |
| March | 2.6 | 1.2 | 3.0 | 5.8 | 4.6 |
| April | 2.5 | 1.0 | 2.9 | 6.3 | 4.3 |
| May | 2.1 | 1.1 | 2.6 | 6.4 | 4.6 |
| June | 1.5 | 1.4 | 2.6 | 6.7 | 4.0 |
| July | 0.8 | 1.3 | 2.7 | 7.6 | 3.1 |
| August | 0.4 | 1.3 | 3.0 | 8.3 | 2.3 |
| September | 0.1 | 1.6 | 3.3 | 9.5 | 0.9 |
| October | 0.4 | 1.7 | 3.4 | 9.5 | 0.8 |
| November | 0.9 | 2.0 | 3.4 | 8.3 | 1.7 |
| December | 1.1 | 2.1 | 3.7 | 7.2 | 2.6 |
| Average | 1.6 | 1.4 | 3.0 | 7.2 | 3.2 |
National Capital Region (NCR)
Likewise, the annual rate of change in the prices of items in NCR for this particular group of consumers moved up further by 2.8 percent in December 2019. In the previous month, inflation in the area was noted at 1.1 percent and in December 2018, 4.8 percent.
Higher annual mark-ups were recorded in the indices of FBT at 3.6 percent; clothing, 1.0 percent; and miscellaneous, 1.6 percent. In addition, the annual growth rates of FLW and services indices both picked up by 0.5 percent, after exhibiting annual decreases in November 2019. Annual change of H&R index remained at 1.4 percent. (Tables 3 and 4)
The annual average inflation in NCR slid to 1.7 percent in 2019, from 6.6 percent in 2018. (Tables 3 and 4A)
Areas Outside NCR (AONCR)
Following the same trend as in the national level and in NCR, inflation for the bottom 30% income households in AONCR accelerated further by 2.6 percent during the month. In November 2019, the annual growth rate was registered at 1.7 percent and in December 2018, 7.3 percent.
Higher annual increases were observed in the indices of FBT at 2.5 percent; FLW, 3.3 percent; and services, 3.1 percent. On the other hand, the indices of clothing and miscellaneous exhibited slower annual paces at 2.8 percent and 2.2 percent, respectively. Annual movement of H&R index remained at 3.7 percent. (Tables 3 and 4)
Compared with their previous month’s annual growth rates, 11 regions in AONCR had higher annual increments during the month. Moreover, inflation rates in Cordillera Administrative Region (CAR), Region I (Ilocos), and Region II (Cagayan Valley) went up during the month after registering negative annual growth rates in the previous month. The highest inflation among the regions in AONCR in December 2019 remained in Bangsamoro Autonomous Region in Muslim Mindanao (BARMM) at 4.9 percent, while the lowest was in Cordillera Administrative Region (CAR) at 0.4 percent. (Table 4)
The annual average inflation in AONCR for the year 2019 eased to 3.3 percent, from 7.2 percent in 2018. (Tables 3 and 4A)
Compared with their 2018 annual average rates, all regions in AONCR had lower annual average inflation in 2019. Region X (Northern Mindanao) posted the lowest annual average inflation during the year at 1.6 percent. Meanwhile, MIMAROPA Region had the highest annual average inflation at 6.8 percent. (Table 4A)
Note:
Monthly CPIs for the bottom 30% income households by province and selected cities are posted at the PSA website (http://openstat.psa.gov.ph/).
See more at the Consumer Price Index for Bottom 30% Income Households Main page.
| Attachment | Size |
|---|---|
|
|
249.35 KB |
|
|
2.26 MB |