
THIRD QUARTER 2017
YEAR-ON-YEAR
Philippines
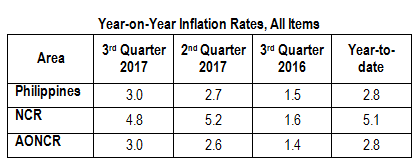
The year-on-year inflation for the bottom 30% income households at the national level picked up by 3.0 percent in the third quarter of 2017. The annual rate in the previous quarter was recorded at 2.7 percent and in the same period in 2016, 1.5 percent. Higher annual increments were posted in the indices of all the commodity groups:
- Food, beverages and tobacco (FBT) (3.0 %);
- Clothing (1.0%);
- Housing and repairs (H&R) (2.6%);
- Fuel, light and water (FLW) (5.2%);
- Services (1.6%); and
- Miscellaneous (1.0%) (see Table 9).
The annual growth of the food alone index moved up at a faster pace of 2.9 percent in the third quarter of 2017. It was pegged at 2.7 percent in the previous quarter and 1.6 percent during the same quarter in 2016 (Table 14).
Higher annual gains were observed in the indices of the following food groups:
- Rice (1.6%);
- Corn (2.2%);
- Cereal preparations (1.3);
- Fish (8.3); and
- Meat (4.9).
On the other hand, the annual increases in the indices of eggs and fruits and vegetables correspondingly slowed down to 2.7 percent and 3.7 percent. In addition, the miscellaneous food index exhibited an annual drop of 0.1 percent, while that of the dairy products index remained at 0.9 percent (Table 10).
| Year-on-Year Inflation Rates in the Philippines, All Items 1st Quarter 2009 - 3rd Quarter 2017 | |||||||||
|---|---|---|---|---|---|---|---|---|---|
| Quarter | Year | ||||||||
| 2009 | 2010 | 2011 | 2012 | 2013 | 2014 | 2015 | 2016 | 2017 | |
| 1st | 12.3 | 4.2 | 4.6 | 2.7 | 3.5 | 5.7 | 3.1 | 1.1 | 2.8 |
| 2nd | 5.5 | 3.5 | 5.4 | 2.4 | 3.1 | 6.5 | 2.1 | 1.2 | 2.7 |
| 3rd | 0.2 | 3.7 | 5.2 | 3.1 | 3.5 | 6.8 | 0.4 | 1.5 | 3.0 |
| 4th | 3.4 | 3.1 | 5.2 | 3.0 | 4.8 | 5.1 | 0.8 | 2.0 | |
| Average | 5.4 | 3.6 | 5.1 | 2.9 | 3.7 | 6.0 | 1.6 | 1.4 | |
National Capital Region (NCR)
Inflation in NCR however, decelerated to 4.8 percent in the third quarter of 2017. In the previous quarter, inflation was observed at 5.2 percent, while in the third quarter of 2016, it was recorded at 1.6 percent. Slower annual increases were noted in the indices of FBT at 5.1 percent; clothing, 1.9 percent; and FLW, 5.7 percent. Meanwhile, higher annual gains were posted in the indices of H&R at 1.9 percent; services, 2.5 percent; and miscellaneous, 4.2 percent (Table 9).
The annual growth of the food alone index slowed down to 4.9 percent during the third quarter. The annual rate was pegged at 5.1 percent in the previous quarter and 2.9 percent in the same period of 2016 (Table 14).
An annual decrease of 0.3 percent was noted in rice index during the quarter. Moreover, slower annual growths were recorded in the indices of the following food groups:
- Dairy products (5.2%);
- Eggs (1.3%);
- Fish (8.9%);
- Fruits and vegetables (12.1%); and
- Meat (4.6%).
The rest of the food groups exhibited higher annual gains during the quarter (Table 10).
Areas Outside NCR (AONCR)
Following the same trend at the national level, inflation in AONCR picked up by 3.0 percent in the third quarter of 2017. In the previous quarter, the annual growth was registered at 2.6 percent and in the same quarter in 2016, 1.4 percent. All the commodity groups posted higher annual mark-ups during the quarter:
- FBT (3.0%);
- Clothing (1.0%);
- H&R (2.6%);
- FLW (5.2%);
- Services (1.6%); and
- Miscellaneous (1.0%).
Annual inflation was higher in eight regions with ARMM having the highest annual rate of 5.7 percent. Meanwhile, the lowest annual growth of 1.0 percent was seen in MIMAROPA (Table 9).
The year-on-year growth of the food alone index rose by 2.9 percent during the quarter. In the previous quarter, its annual rate was posted at 2.7 percent and in the same period in 2016, 1.6 percent (Table 14).
A faster annual increase of 1.6 percent was recorded in rice index during the quarter as six regions registered higher annual mark-ups. The highest annual growth of 5.4 percent was seen in ARMM, while the lowest of -1.0 percent was both noticed in Region X (Northern Mindanao) and Region XI (Davao Region). A zero growth was seen in Region XII (SOCCSKSARGEN) this quarter.
Higher annual rates were also noted in the indices of the following food groups:
- Corn (2.2%);
- Cereal preparations (1.2%);
- Dairy products (0.8%);
- Fish (8.3%); and
- Meat (5.0%).
The rest of the food groups had slower annual gains with the index of miscellaneous foods exhibiting an annual decrease of 0.3 percent (Table 10).
QUARTER-ON-QUARTER
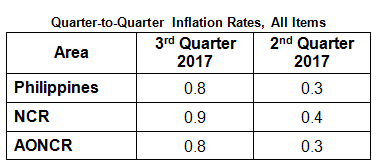
The country’s consumer prices for the bottom 30% income households climbed by 0.8 percent in the third quarter of 2017. In the previous quarter, it was pegged at 0.3 percent. Quarterly growths were higher in the indices of the following commodity groups:
- FBT (0.9%);
- Clothing (0.5%);
- H&R (1.0%);
- Services (0.8%); and
- Miscellaneous (0.4%).
The FLW index registered a positive growth of 0.5 percent from a 0.1 percent decline in the previous quarter.
Higher quarterly increases were noted in seven regions with ARMM having the highest rate of 2.6 percent. Moreover, six regions posted quarterly increments compared to their negative rates in the previous quarter. Caraga however, registered a zero growth during this quarter (Table 11).
The heavily-weighted food items, such as rice, corn and fish were priced higher in many regions. Price hikes in LPG, kerosene, some items for household operations and personal effects in many provinces also contributed to the uptrend (Table 12).
Note:
- Monthly CPIs for the bottom 30% income households by province and selected cities are also available upon request at PSA, Price Statistics Division (Telephone Number: 376-1959)
- The CPIs for the second quarter of 2017 were recomputed to include Lanao del Sur and Marawi City for comparability purposes with those for the third quarter of 2017.
| Attachment | Size |
|---|---|
|
|
246.5 KB |