Population of Ifugao increased at the rate of 1.69 percent annually
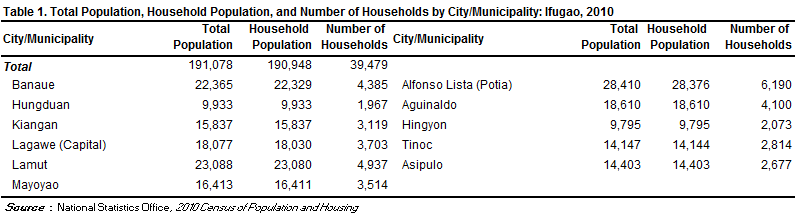
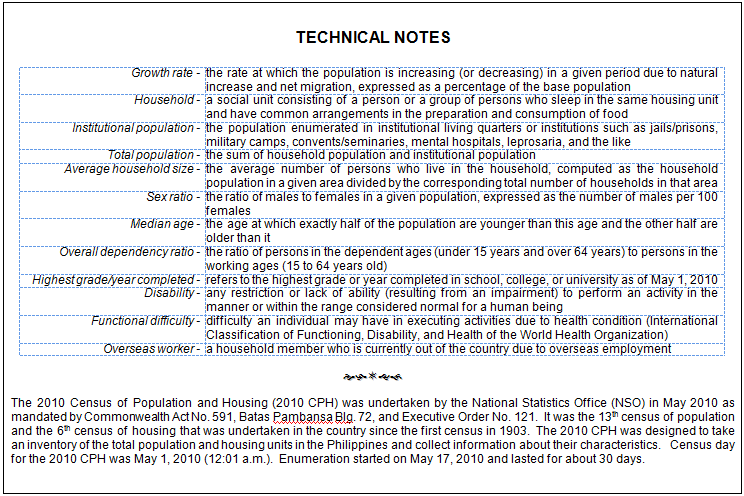
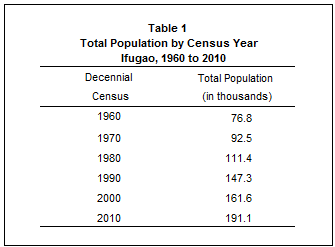
Based on the 2010 Census of Population and Housing (CPH), the province of Ifugao posted a total population of 191,078 persons as of May 1, 2010, larger by 29,455 persons compared to its total population of 161,623 persons counted in the 2000 CPH. The increase in the population count from 2000 to 2010 translated to an average annual population growth rate (PGR) of 1.69 percent. This is higher than the 0.93 percent annual PGR of the province between the census years 1990 and 2000.
If the average annual PGR recorded at 1.69 percent during the period 2000 to 2010 continues, the population of Ifugao would double in 41 years.
Fifty years ago, the population of Ifugao was only 76,788 persons. This population size is two fifths of the population of the province in the 2010 CPH.
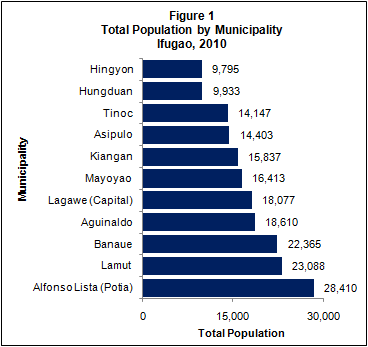
Alfonso Lista (Potia) was the most populous
Among the 11 municipalities comprising the province of Ifugao, Alfonso Lista (Potia) was the most populous with a population size making up 14.9 percent of the total provincial population. The municipality of Lamut was second with 12.1 percent share, followed by the municipalities of Banaue with 11.7 percent, Aguinaldo with 9.7 percent, Lagawe, the provincial capital, with 9.5 percent, Mayoyao with 8.6 percent, Kiangan 8.3 percent, Asipulo with 7.5 percent, Tinoc with 7.4 percent, Hungduan with 5.2 percent, and Hingyon with 5.1 percent.
In 2000, Hungduan was the least populated municipality.
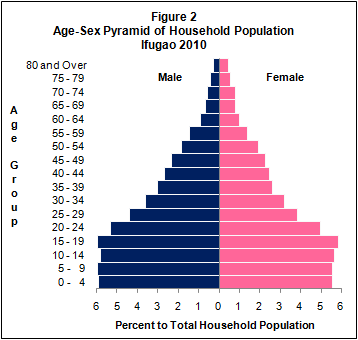
Sex ratio was 106 males per 100 females
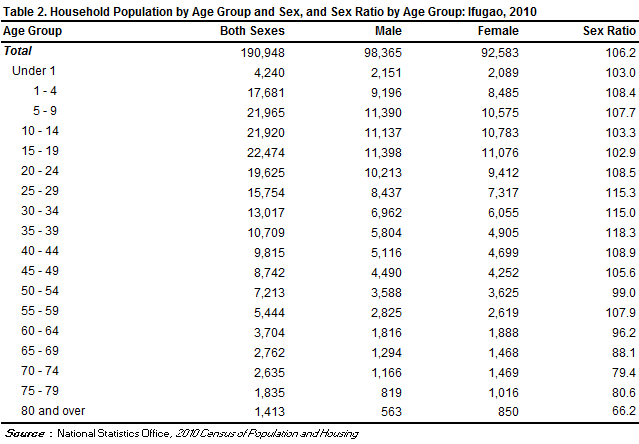
Of the 190,948 household population in 2010, males accounted for 51.5 percent while females comprised 48.5 percent. These figures resulted in a sex ratio of 106 males for every 100 females. In 2000, the recorded sex ratio was 104 males per 100 females.
Median age increased to 21.8 years
In 2010, the median age of the population of the province was 21.8 years, which means that half of the population was younger than 21.8 years. This is higher than the median age of 19.1 years that was recorded in 2000.
Moreover, one in every three persons (34.5 percent) were under 15 years old. Children aged 15 to 19 years (11.8 percent) comprised the largest age group, followed by those in the age groups 0 to 4 years, 5 to 9 years, and 10 to 14 years (11.5 percent each). Males outnumbered females in the age groups 0 to 49 years and 55 to 59 years. On the other hand, there were more females than males in the age groups 50 to 54 years and 60 years and over.
Three fifths of the population were of voting age
The voting-age population (18 years and over) accounted for 58.4 percent of the household population of the province in 2010, up from 52.6 percent in 2000. There were more males (51.6 percent) than females (48.4 percent) among the voting-age population.
Dependency ratio decreased to 64 dependents per 100 persons in the working age group
In 2010, the young dependents (0 to 14 years) comprised 34.5 percent of the household population while the old dependents (65 years and over) posted a share of 4.5 percent. The working-age population (15 to 64 years) accounted for the remaining 61.0 percent.
The overall dependency ratio was 64, which indicates that for every 100 working-age population, there were about 64 dependents (57 young dependents and seven old dependents). This ratio is lower than the dependency ratio in 2000, which was recorded at 81 dependents per 100 working-age population (73 young dependents and eight old dependents).
There were more males than females among the never-married persons
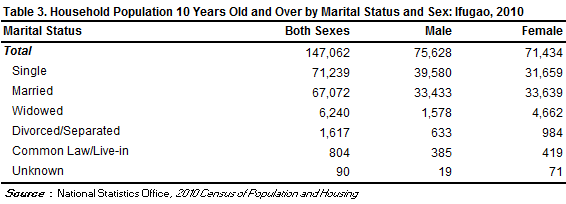
Of the household population 10 years old and over, 48.4 percent were never married while 45.6 percent were married. The rest of the population were categorized as follows: widowed (4.2 percent), divorced/separated (1.1 percent), and common law/live in marital arrangement (0.5 percent).
Among the never-married persons, 55.6 percent were males while 44.4 percent were females. For the rest of the categories for marital status, the females outnumbered the males.
More females had attained higher levels of education
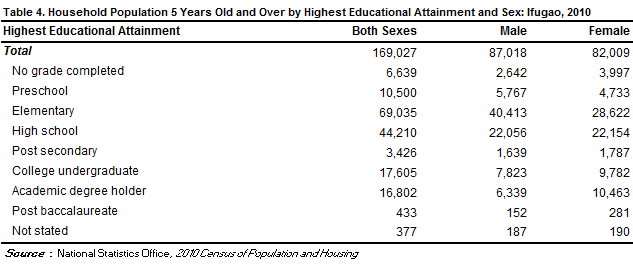
Of the household population aged five years and over, 40.8 percent had attended or completed elementary education, 26.2 percent had reached or finished high school, 10.4 percent were college undergraduates and 9.9 percent were academic degree holders. Females outnumbered males among those with higher levels of education as they comprised 62.3 percent of all those with an academic degree and 64.9 percent of all those who pursued post baccalaureate course.
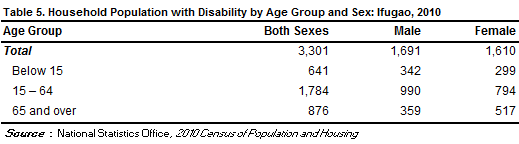
Persons with disability comprised 1.7 percent of the population in the province
In 2010, around 3,300 persons or 1.7 percent of the 190,948 household population had a disability. The proportion of persons with disability (PWD) in 2000 was 1.3 percent of the 161,483 household population of the province during that year. The number of PWD for the same year was around 2,100.
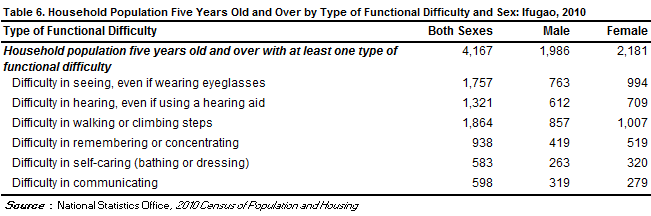
More females than males among those with functional difficulty
Of the 169,027 household population five years old and over, 2.5 percent (or 4,167 persons) had at least one type of functional difficulty either in seeing, hearing, walking or climbing steps, remembering or concentrating, self-caring (bathing or dressing) or communicating. There were more females (52.3 percent) than males (47.7 percent) among those persons with at least one type of functional difficulty.
Moreover, of the total 4,167 persons aged five years old and over with at least one type of functional difficulty, 44.7 percent reported difficulty in walking or climbing steps. There were 42.2 percent who had difficulty in seeing, even if wearing eyeglasses; 31.7 percent had difficulty in hearing, even if using a hearing aid; 22.5 percent had difficulty in remembering or concentrating; 14.4 percent had difficulty in communicating; 14.0 percent had difficulty in self-caring (bathing or dressing).
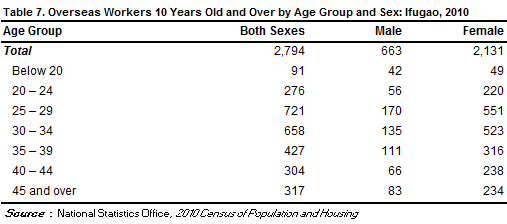
Female overseas workers outnumbered their male counterparts
Of the 147,062 household population 10 years old and over in Ifugao, 1.9 percent (or 2,794 persons) were overseas workers. Female overseas workers outnumbered their male counterparts as they comprised 76.3 percent of all the overseas workers from this province. Overseas workers aged 25 to 29 years made up the largest age group, comprising 25.8 percent of the total overseas workers from this province in 2010, followed by the age groups 30 to 34 (23.6 percent), 35 to 39 years (15.3 percent), and 45 years and over (11.3 percent).
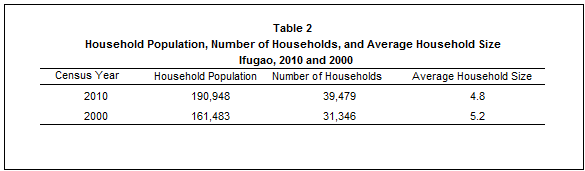
Average household size was 4.8 persons
The number of households in 2010 was recorded at 39,479, higher by 8,133 households compared with the 31,346 households posted in 2000. The average household size in 2010 was 4.8 persons, lower than the average household size of 5.2 persons in 2000.
There were 100 households per 100 occupied housing units
A total of 39,313 occupied housing units were recorded in the province of Ifugao in 2010. This translates to a ratio of 100 households for every 100 occupied housing units, with 4.9 persons per occupied housing unit. In 2000, there were 101 households per 100 occupied housing units and 5.2 persons per occupied housing unit.
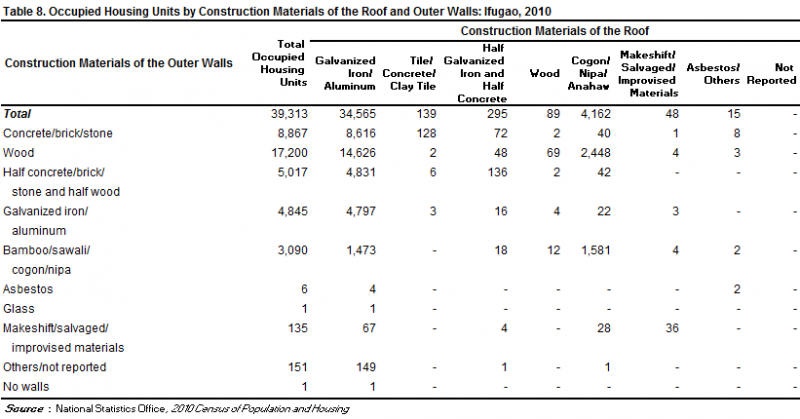
Occupied housing units with outer walls and roofs made of strong materials increased
In 2010, 43.8 percent of the occupied housing units in the province had outer walls made of wood, down from 50.4 percent in 2000. The proportion of occupied housing units with outer walls made of concrete/brick/stone increased from 10.9 percent in 2000 to 22.6 percent in 2010. Those with outer walls made of half concrete/brick/stone and half wood increased from 9.7 percent in 2000 to 12.8 percent in 2010. Meanwhile, 87.9 percent of the occupied housing units in 2010 had roofs made of galvanized iron/aluminum. This is higher than the proportion recorded in 2000 at 70.6 percent. The proportion of occupied housing units with roofs made of cogon/nipa/anahaw, on the other hand, decreased from 26.8 percent in 2000 to 10.6 percent in 2010.
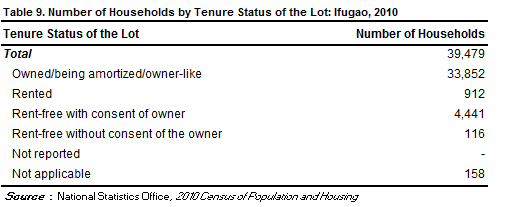
More than four in every five households in the province lived in lots that they owned or amortized
In 2010, 85.7 percent of the total 39,479 households owned or amortized the lots they occupied. The corresponding figure in 2000 was 85.5 percent of the 31,346 households.
Moreover, 11.2 percent of the households occupied lots which were rent-free but with consent of owner, 2.3 percent rented the lots that they occupied while 0.3 percent occupied lots which were rent-free but without consent of the owner.