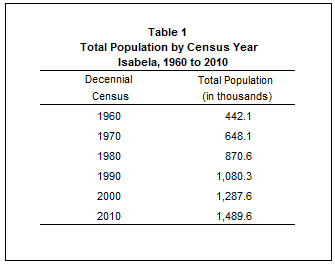
Population of Isabela increased at the rate of 1.47 percent annually
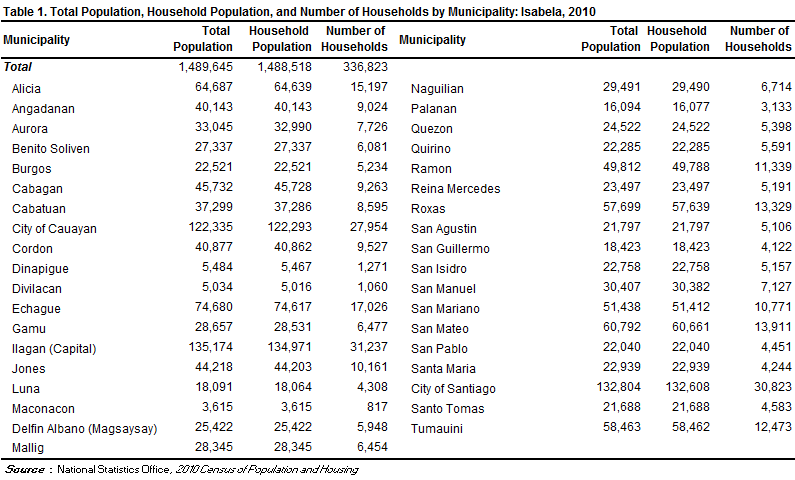
Based on the 2010 Census of Population and Housing (CPH), the province of Isabela posted a total population of 1,489,645 persons as of May 1, 2010. This is larger by 202,070 persons compared to its total population of 1,287,575 persons counted in the 2000 CPH. The increase in the population count from 2000 to 2010 translated to an average annual population growth rate (PGR) of 1.47 percent. This is lower than the 1.77 percent annual PGR of the province between the census years 1990 and 2000.
If the average annual PGR recorded at 1.47 percent during the period 2000 to 2010 continues, the population of Isabela would double in 48 years.
Fifty years ago, the population of Isabela was only 442,062 persons. This population size is less than one third of the population of the province in the 2010 CPH.
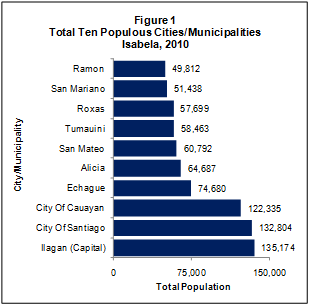
Municipality of Ilagan was the most populous
Among the two cities and 35 municipalities comprising the province of Isabela, the municipality of Ilagan, the provincial capital, was the most populous with a population size making up 9.1 percent of the total provincial population. The City of Santiago was second with 8.9 percent share while the City of Cauayan came in third with 8.2 percent, followed by the municipalities of Echague with 5.0 percent, Alicia with 4.3 percent, San Mateo with 4.1 percent, Tumauini and Roxas with 3.9 percent each, San Mariano with 3.5 percent, Ramon with 3.3 percent, and Cabagan and Jones with 3.1 percent each. The rest of municipalities contributed less than 3.0 percent each.
The least populated area was the municipality of Maconacon with 0.2 percent share to the total population of the province. In 2000, the least populated area was Dinapigue.
Sex ratio remained at 104 males per 100 females
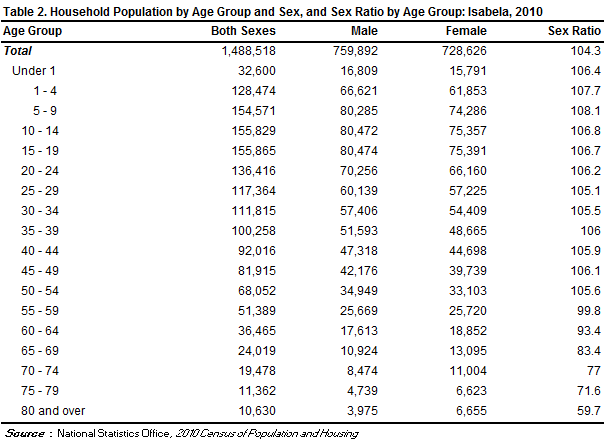
Of the 1,488,518 household population in 2010, males accounted for 51.1 percent while females comprised 48.9 percent. These figures resulted in a sex ratio of 104 males for every 100 females, which is similar to the sex ratio recorded in 2000 (105 males per 100 females).
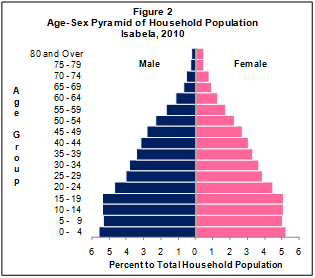
Median age increased to 24.3 years
In 2010, the median age of the population of the province was 24.3 years, which means that half of the population was younger than 24.3 years. This is higher than the median age of 21.0 years that was recorded in 2000.
Moreover, approximately one in every three persons (31.7 percent) was under 15 years old. Children aged 0 to 4 years (10.8 percent) comprised the largest age group, followed by those in the age groups 10 to 14 years and 15 to 19 years (10.5 percent each), and 5 to 9 years (10.4 percent). Males outnumbered females in the age groups 0 to 54 years. On the other hand, there were more females than males in the older age groups (55 years and over).
Three fifths of the population were of voting age
The voting-age population (18 years and over) accounted for 62.0 percent of the household population of the city in 2010, up from 55.9 percent in 2000. There were more males (50.6 percent) than females (49.4 percent) among the voting-age population.
Dependency ratio decreased to 56 dependents per 100 persons in the working age group
In 2010, the young dependents (0 to 14 years) comprised 31.7 percent of the household population while the old dependents (65 years and over) posted a share of 4.4 percent. The working-age population (15 to 64 years) accounted for the remaining 63.9 percent.
The overall dependency ratio was 56, which indicates that for every 100 working-age population, there were about 56 dependents (49 young dependents and seven old dependents). This ratio is lower than the dependency ratio in 2000, which was recorded at 70 dependents per 100 working-age population (64 young dependents and six old dependents).
There were more males than females among the never-married persons
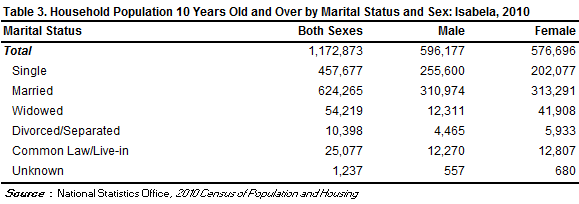
Of the household population 10 years old and over, 53.2 percent were married while 39.0 percent were never married. The rest of the population was categorized as follows: widowed (4.6 percent), in common-law/live-in marital arrangement (2.1 percent), and divorced/separated (0.9 percent).
Among the never-married persons, 55.8 percent were males while 44.2 percent were females. For the rest of the categories for marital status, the females outnumbered the males.
More females had attained higher levels of education
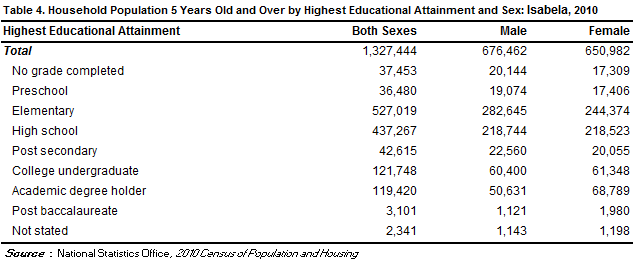
Of the household population aged five years and over, 39.7 percent had attended or completed elementary education, 32.9 percent had reached or finished high school, 9.2 percent were college undergraduates, and 9.0 percent were academic degree holders. Among those with an academic degree, the females (57.6 percent) outnumbered the males (42.4 percent). Similarly, more females (63.9 percent) than males (36.1 percent) had pursued post baccalaureate courses.
Persons with disability comprised 1.6 percent of the population in the province
In 2010, around 23,600 persons or 1.6 percent of the 1,488,518 household population had a disability. This proportion of persons with disability (PWD) is higher than the proportion in 2000, which was 1.1 percent of the 1,286,515 household population of the province during that year. The number of PWD for the same year was around 14,200.
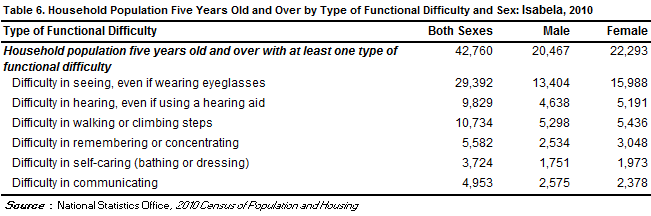
More females than males among those with functional difficulty
Of the 1,327,444 household population five years and over, 3.2 percent (or 42,760 persons) had at least one type of functional difficulty either in seeing, hearing, walking or climbing steps, remembering or concentrating, self-caring (bathing or dressing), or communicating. There were more females (52.1 percent) than males (47.9 percent) among those persons with at least one type of functional difficulty.
Moreover, of the total 42,760 persons aged five years and over with at least one type of functional difficulty, 68.7 percent reported difficulty in seeing, even if wearing eyeglasses. There were 25.1 percent who had difficulty in walking or climbing steps; 23.0 percent had difficulty in hearing, even if using a hearing aid; 13.1 percent had difficulty in remembering or concentrating; 11.6 percent had difficulty in communicating; and 8.7 percent had difficulty in self-caring (bathing or dressing).
Female overseas workers outnumbered their male counterparts
Of the 1,172,873 household population 10 years old and over in Isabela, 3.1 percent (or 36,073 persons) were overseas workers. Female overseas workers outnumbered their male counterparts as they comprised 70.4 percent of all the overseas workers from this province. Overseas workers aged 25 to 29 years and 30 to 34 years made up the largest age group, comprising (21.8 percent each) of the total overseas workers from this province in 2010, followed by the age groups 35 to 39 years (17.0 percent) and 45 years and over (13.5 percent).
Average household size was 4.4 persons
The number of households in 2010 was recorded at 336,823, higher by 81,841 households compared with the 254,982 households posted in 2000. The average household size in 2010 was 4.4 persons, lower than the average household size of 5.0 persons in 2000.

There were 102 households per 100 occupied housing units
A total of 330,467 occupied housing units were recorded in the province of Isabela in 2010. This translates to a ratio of 102 households for every 100 occupied housing units, with 4.5 persons per occupied housing unit. In 2000, there were 102 households per 100 occupied housing units, and 5.2 persons per occupied housing unit.
Occupied housing units with outer walls and roofs made of strong materials increased
In 2010, more than half (58.6 percent) of the occupied housing units in the province had outer walls made of concrete/brick/stone, up from 37.9 percent in 2000. The proportion of occupied housing units with outer walls made of bamboo/sawali/cogon/nipa decreased from 33.6 percent in 2000 to 18.0 percent in 2010. Those with walls made of half concrete/brick/stone and half wood decreased from 16.2 percent in 2000 to 13.2 percent in 2010. Meanwhile, 88.1 percent of the occupied housing units in 2010 had roofs made of galvanized iron/aluminum. This is higher than the proportion of 73.3 percent recorded in 2000. Those with roofs made of cogon/nipa/anahaw decreased from 21.6 percent in 2000 to 8.9 percent in 2010.
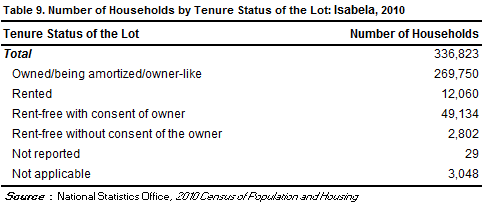
Majority of the households lived in lots that they owned or amortized
In 2010, of the total 336,823 households, four in five (80.1 percent) owned or amortized the lots that they occupied. The corresponding figure in 2000 was 71.1 percent.
Moreover, 14.6 percent of the households occupied lots which were rent-free but with consent of the owner, 3.6 percent rented the lots that they occupied while 0.8 percent occupied lots which were rent-free but without consent of the owner.