
|
Total Manufacturing |
April 2004 |
March 2004 |
|
Year-on-Year Growth |
|
|
|
Production Index |
|
|
|
Value(VaPI) |
2.8 |
-5.0r |
|
Volume(VoPI) |
-5.2 |
-10.3r |
|
Net Sales Index |
|
|
|
Value |
20.2 |
4.0r |
|
Volume |
7.6 |
-4.2r |
|
Producer's Price Index |
8.5 |
5.8r |
|
Average Capacity Utilization |
78.8 |
78.8r |
r -revised
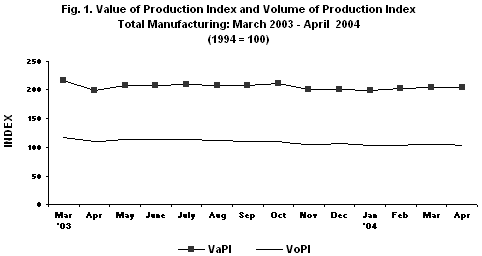
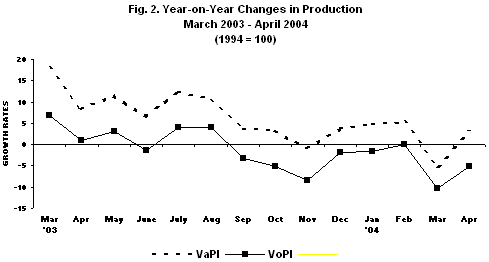
· Value of Production Index (VaPI) recovers
Value of Production Index (VaPI) for the manufacturing industry on a year-on-year basis managed to improve by 2.8 percent in April 2004, from a drop of (revised) 5.0 percent recorded during the previous month, according to the preliminary results of the Monthly Integrated Survey of Selected Industries (MISSI). Significant increases were exhibited in the following sectors: publishing and printing, electrical machinery, beverage, rubber products, textile, food manufacturing, fabricated metal products and furniture and fixtures (see Table 1-A).
On a month-on-month basis, VaPI in April 2004 remained unchanged. Nevertheless, double digit increases were noted in four (4) sectors, namely: petroleum products, wood and wood products, publishing and printing and fabricated metal products (see Table 1-A).
· Volume of Production Index (VoPI) is still down
Volume of Production Index (VoPI) compared to the year-ago level posted a decline of 5.2 percent in April 2004. Leather products had the biggest decrease among the sectors with a drop of 95.0 percent. Other sectors with double digit decreases were the following: footwear and wearing apparel, petroleum products, basic metals, non-metallic mineral products, miscellaneous manufactures and wood and wood products (see Table 1-B).
On a monthly comparison, VoPI likewise went down by 0.7 percent in April 2004. Double digit decreases were noted in the following sectors: furniture and fixtures, footwear and wearing apparel, leather products, tobacco, basic metals, machinery excluding electrical and miscellaneous manufactures (see Annex 1-B).
· Value of Net Sales posts higher growth
Year-on-year growth rate of Value of Net Sales registered a significant increase of 20.2 percent in April 2004. Twelve (12) sectors recorded double-digit growth rates led by electrical machinery. Other sectors with double-digit increments were the following: basic metals, publishing and printing, textile, rubber products, petroleum products, leather products, miscellaneous manufactures, non-metallic mineral products, food manufacturing, chemical products and fabricated metal products (see Table 2-A).
However, Value of Net Sales on a month-on-month comparison slipped by 4.8 percent in April 2004, from a positive growth of (revised) 8.4 percent in March this year. Footwear and wearing apparel sector posted the biggest decrease followed by six (6) other sectors: furniture and fixtures, paper and paper products, leather products, basic metals, transport equipment and beverage (see Table 2-A).
· Volume of Net Sales improves
For April 2004, Net Sales Volume picked up by 7.6 percent compared with the year-ago figure. Major sectors contributing to the increase were the following: electrical machinery, publishing and printing, rubber products, leather products, miscellaneous manufactures, basic metals, wood and wood products, furniture and fixtures, textile and petroleum products (see Table 2-B).
On the other hand, Volume of Net Sales on a month-on-month basis fell by 5.9 percent in April 2004. This was due to the relatively poor sales performance of the following sectors: footwear and wearing apparel, furniture and fixtures, paper and paper products, leather products, basic metals, transport equipment, beverage and textile (see Table 2-B).

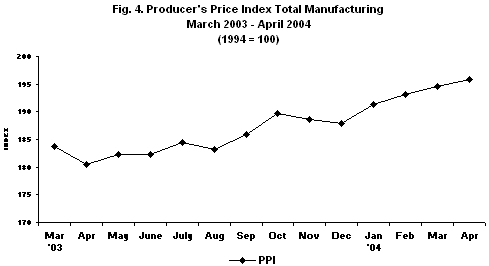
· Producer's Price Index (PPI) continues upward trend
The Producer's Price Index (PPI) for total manufacturing on a year-on-year basis reported an increase of 8.5 percent in April 2004. This was mainly due to double-digit increases in producer's prices of the following sectors: footwear and wearing apparel, basic metals, food manufacturing, electrical machinery, non-metallic mineral products, petroleum products and textile (see Table 5).
On a monthly basis, PPI for total manufacturing gained 0.7 percent in April 2004. Sectors that posted increases were the following: footwear and wearing apparel, textile, food manufacturing, petroleum products, electrical machinery, basic metals, chemical products, furniture and fixtures, non-metallic mineral products and beverage (see Table 5).
· Capacity Utilization
Average capacity utilization in April 2004 for total manufacturing was estimated at 78.8 percent. Sectors that posted more than 80% capacity utilization rate were the following: machinery excluding electrical, electrical machinery, leather products, paper and paper products, rubber products, miscellaneous manufactures, petroleum products, basic metals and food manufacturing (see Table 6).
The proportion of establishments that operated at full capacity (90%-100%) in April 2004 was 12.7 percent. More than half or 53.0 percent of the establishments operated at 70%-89% capacity and 34.4 percent of the establishments operated below 70% capacity.
Distribution of Key Manufacturing Establishments by Capacity Utilization
Total Manufacturing, April 2004
(In percent)
|
Capacity Utilization |
1994-based |
|
Below 50 percent |
8.6 |
|
50 percent - 59 percent |
7.3 |
|
60 percent - 69 percent |
18.5 |
|
70 percent - 79 percent |
23.4 |
|
80 percent - 89 percent |
29.6 |
|
90 percent - 100 percent |
12.7 |
· Response Rate
The response rate for April 2004 is 91.4 percent, which corresponds to the retrieval of 492 sample establishments' reports (see Table 7).
Response Rates for Total Manufacturing
(In percent)
|
April 2004 |
March 2004 |
|
91.4 |
95.2 |
· Technical Notes
Starting 2004, weights for the Producer's Price Index (PPI) are based from the results of the 2000 Census of Philippine Business and Industry (CPBI) for establishments with average total employment (ATE) of 20 and over. Reference year for the 2000 CPBI is 1999 (Refer to Press Release on Revision of 2004 PPI weights).
Data of nonresponding sample establishments are estimated based on previous records and other available sources. Revisions to the preliminary estimates are done upon receipt of actual reports of late respondents.
|
|
(Sgd.) CARMELITA N. ERICTA |
TABLE 1-A. VALUE OF PRODUCTION INDEX, March-April 2004
(1994 =100)
|
Gainers |
Year-on-Year Growth (percent) |
|
|
April 2004 |
March 2004 |
|
|
Electrical machinery |
26.2 |
13.2 |
|
Food manufacturing |
14.2 |
-0.7 |
|
Beverage |
25.7 |
18.4 |
|
Textile |
14.6 |
3.3 |
|
Publishing and printing* |
35.2 |
17.1 |
|
Basic metals |
5.6 |
22.0 |
|
Transport equipment |
4.6 |
-22.6 |
|
Fabricated metal products* |
14.1 |
-4.2 |
|
Chemical products |
1.7 |
3.4 |
|
Rubber products |
22.7 |
11.4 |
|
Furniture and fixtures |
10.8 |
6.9 |
|
Machinery excluding electrical* |
0.4 |
17.6 |
|
|
||
|
Losers |
Year-on-Year Growth (percent) |
|
|
April 2004 |
March 2004 |
|
|
Petroleum products |
-27.7 |
-49.1 |
|
Footwear and wearing apparel* |
-17.4 |
-1.5 |
|
Wood and wood products |
-17.9 |
-28.8 |
|
Paper and paper products |
-8.4 |
-0.1 |
|
Miscellaneous manufactures |
-13.5 |
3.6 |
|
Leather products* |
-94.9 |
-92.4 |
|
Tobacco |
-2.3 |
-17.2 |
|
Nonmetallic mineral products |
-0.2 |
1.3 |
TABLE 1-A. VALUE OF PRODUCTION INDEX, March-April 2004
(concluded)
(1994=100)
|
Gainers |
Month-on-Month Growth (percent) |
|
|
April 2004 |
March 2004 |
|
|
Petroleum products |
42.6 |
-30.2 |
|
Wood and wood products |
14.9 |
-4.3 |
|
Publishing and printing* |
6.0 |
5.0 |
|
Fabricated metal products* |
2.8 |
7.6 |
|
|
||
|
Losers |
Month-on-Month Growth (percent) |
|
|
April 2004 |
March 2004 |
|
|
Basic metals |
-14.0 |
-4.6 |
|
Chemical products |
-5.7 |
5.5 |
|
Food manufacturing |
-3.2 |
5.5 |
|
Tobacco |
-16.0 |
-1.2 |
|
Footwear and wearing apparel* |
-9.8 |
15.4 |
|
Transport equipment |
-6.6 |
14.6 |
|
Electrical machinery |
-2.2 |
9.1 |
|
Machinery excluding electrical* |
-12.9 |
6.5 |
|
Beverage |
-3.0 |
25.7 |
|
Paper and paper products |
-7.6 |
2.1 |
|
Nonmetallic mineral products |
-4.3 |
4.5 |
|
Furniture and fixtures |
-21.4 |
31.4 |
|
Miscellaneous manufactures |
-11.1 |
12.4 |
|
Textile |
-1.3 |
3.9 |
|
Leather products* |
-16.5 |
22.3 |
|
Rubber products |
-2.8 |
7.1 |
Note: * - new sectors in the 1994-based series
Sectors are ranked according to their contribution to the overall 1994-based April 2004 growth rate.
Year-on-year growth rates are computed by dividing the current month index by previous year same month index less 1.
Month-on-month growth rates are computed by dividing the current month index by previous month index less 1.
TABLE 1-B. VOLUME OF PRODUCTION INDEX, March - April 2004
(1994 = 100)
|
Gainers |
Year-on-Year Growth (percent) |
|
|
April 2004 |
March 2004 |
|
|
Beverage |
32.9 |
25.3 |
|
Electrical machinery |
8.0 |
6.5 |
|
Publishing and printing* |
35.2 |
17.1 |
|
Rubber products |
23.8 |
12.7 |
|
Textile |
3.5 |
-8.3 |
|
Furniture and fixtures |
18.0 |
15.7 |
|
Fabricated metals* |
12.3 |
-5.8 |
|
|
||
|
Losers |
Year-on-Year Growth (percent) |
|
|
April 2004 |
March 2004 |
|
|
Petroleum products |
-34.7 |
-52.4 |
|
Footwear and wearing apparel* |
-42.0 |
-18.7 |
|
Basic metals |
-18.8 |
-3.6 |
|
Food manufacturing |
-2.7 |
-13.9 |
|
Nonmetallic mineral products |
-13.8 |
-12.5 |
|
Chemical products |
-3.4 |
-1.3 |
|
Tobacco |
-7.1 |
-21.2 |
|
Transport equipment |
-0.8 |
-26.6 |
|
Miscellaneous manufactures |
-13.7 |
4.5 |
|
Leather products* |
-95.0 |
-92.5 |
|
Wood and wood products |
-11.5 |
-23.0 |
|
Machinery excluding electrical* |
-2.8 |
13.9 |
|
Paper and paper products |
-1.7 |
8.8 |
TABLE 1-B. VOLUME OF PRODUCTION INDEX, March - April 2004
(concluded)
(1994=100)
|
Gainers |
Month-on-Month Growth (percent) |
|
|
April 2004 |
March 2004 |
|
|
Petroleum products |
41.0 |
-30.9 |
|
Wood and wood products |
15.1 |
-7.2 |
|
Publishing and printing* |
6.0 |
5.0 |
|
Fabricated metals products* |
2.8 |
7.6 |
|
|
||
|
Losers |
Month-on-Month Growth (percent) |
|
|
April 2004 |
March 2004 |
|
|
Basic metals |
-14.9 |
-6.3 |
|
Food manufacturing |
-4.5 |
4.7 |
|
Footwear and wearing apparel* |
-18.5 |
18.2 |
|
Chemical products |
-6.6 |
2.8 |
|
Tobacco |
-16.0 |
-1.2 |
|
Transport equipment |
-6.6 |
14.1 |
|
Electrical machinery |
-3.3 |
8.5 |
|
Beverage |
-3.2 |
25.6 |
|
Machinery excluding electrical* |
-12.9 |
6.5 |
|
Nonmetallic mineral products |
-4.7 |
4.7 |
|
Furniture and fixtures |
-22.0 |
31.3 |
|
Paper and paper products |
-7.1 |
3.8 |
|
Textile |
-4.6 |
3.9 |
|
Miscellaneous manufactures |
-10.9 |
12.2 |
|
Leather products* |
-16.1 |
22.3 |
|
Rubber products |
-2.8 |
4.4 |
Note: * - new sectors in the 1994-based series
Sectors are ranked according to their contribution to the overall 1994-based April 2004 growth rate.
Year-on-year growth rates are computed by dividing the current month index by previous year same month index less 1.
Month-on-month growth rates are computed by dividing the current month index by previous month index less 1.
TABLE 2-A. VALUE OF NET SALES, March - April 2004
(1994=100)
|
Gainers |
Year-on-Year Growth (percent) |
|
|
April 2004 |
March 2004 |
|
|
Electrical machinery |
68.5 |
-7.7 |
|
Basic metals |
49.8 |
14.3 |
|
Food manufacturing |
15.1 |
4.5 |
|
Petroleum products |
22.0 |
14.4 |
|
Chemical products |
12.9 |
3.4 |
|
Textile |
24.6 |
9.6 |
|
Nonmetallic mineral products |
16.6 |
10.5 |
|
Publishing and printing* |
24.6 |
-14.4 |
|
Miscellaneous manufactures |
20.0 |
19.2 |
|
Fabricated metal products* |
11.5 |
-8.7 |
|
Rubber products |
22.1 |
23.0 |
|
Beverage |
2.4 |
6.4 |
|
Machinery excluding electrical* |
8.2 |
4.5 |
|
Transport equipment |
1.7 |
-7.4 |
|
Wood and wood products |
5.9 |
-20.4 |
|
Furniture and fixtures |
6.0 |
-5.3 |
|
Leather products* |
21.9 |
125.1 |
|
|
||
|
Losers |
Year-on-Year Growth (percent) |
|
|
April 2004 |
March 2004 |
|
|
Footwear and wearing apparel* |
-29.2 |
9.2 |
|
Tobacco |
-6.4 |
-8.8 |
|
Paper and paper products |
-1.8 |
-0.3 |
TABLE 2-A. VALUE OF NET SALES, March - April 2004 (concluded)
(1994=100)
|
Gainers |
Month-on-Month Growth (percent) |
|
|
April 2004 |
March 2004 |
|
|
Electrical machinery |
2.8 |
-8.2 |
|
Fabricated metal products* |
9.0 |
-3.7 |
|
Publishing and printing* |
9.0 |
11.3 |
|
Wood and wood products |
3.5 |
26.1 |
|
Machinery excluding electrical* |
1.5 |
-0.1 |
|
|
||
|
Losers |
Month-on-Month Growth (percent) |
|
|
April 2004 |
March 2004 |
|
|
Footwear and wearing apparel* |
-25.8 |
9.3 |
|
Basic metals |
-14.6 |
17.1 |
|
Transport equipment |
-13.5 |
6.8 |
|
Beverage |
-11.4 |
27.6 |
|
Chemical products |
-4.4 |
12.3 |
|
Food manufacturing |
-2.3 |
7.8 |
|
Paper and paper products |
-20.0 |
12.6 |
|
Textile |
-7.3 |
2.9 |
|
Furniture and fixtures |
-20.7 |
13.8 |
|
Tobacco |
-1.1 |
3.0 |
|
Petroleum products |
-0.2 |
11.8 |
|
Leather products* |
-17.6 |
27.4 |
|
Nonmetallic mineral products |
-0.7 |
-1.8 |
|
Miscellaneous manufactures |
-2.0 |
11.7 |
|
Rubber products |
-0.2 |
25.6 |
Note: * - new sectors in the 1994-based series
Sectors are ranked according to their contribution to the overall 1994-based April 2004 growth rate.
Year-on-year growth rates are computed by dividing the current month index by previous year same month index less 1.
Month-on-month growth rates are computed by dividing the current month index by previous month index less 1.
TABLE 2-B. VOLUME OF NET SALES, March - April 2004
(1994=100)
|
Gainers |
Year-on-Year Growth (percent) |
|
|
April 2004 |
March 2004 |
|
|
Electrical machinery |
44.2 |
-13.2 |
|
Petroleum products |
10.2 |
7.2 |
|
Basic metals |
15.3 |
-9.7 |
|
Chemical products |
7.3 |
-1.3 |
|
Beverage |
8.2 |
12.6 |
|
Textile |
12.6 |
-2.8 |
|
Publishing and printing |
24.6 |
-14.4 |
|
Miscellaneous manufactures |
19.7 |
20.2 |
|
Fabricated metal products* |
9.7 |
-10.2 |
|
Rubber products |
23.3 |
24.5 |
|
Wood and wood products |
14.1 |
-13.9 |
|
Paper and paper products |
5.4 |
8.5 |
|
Furniture and fixtures |
12.8 |
2.6 |
|
Machinery excluding electrical* |
4.8 |
1.2 |
|
Leather products* |
20.5 |
122.2 |
|
Nonmetallic mineral products |
0.7 |
-4.5 |
|
|
||
|
Losers |
Year-on-Year Growth (percent) |
|
|
April 2004 |
March 2004 |
|
|
Footwear and wearing apparel* |
-50.2 |
-9.9 |
|
Food manufacturing |
-2.0 |
-9.3 |
|
Tobacco |
-11.0 |
-13.2 |
|
Transport equipment |
-3.5 |
-12.1 |
TABLE 2-B. VOLUME OF NET SALES, March - April 2004 (concluded)
(1994=100)
|
Gainers |
Month-on-Month Growth (percent) |
|
|
April 2004 |
March 2004 |
|
|
Electrical machinery |
1.7 |
-8.7 |
|
Fabricated metal products* |
9.0 |
-3.7 |
|
Publishing and printing* |
9.0 |
11.3 |
|
Wood and wood products |
3.7 |
22.3 |
|
Machinery excluding electrical* |
1.5 |
-0.1 |
|
|
||
|
Losers |
Month-on-Month Growth (percent) |
|
|
April 2004 |
March 2004 |
|
|
Footwear and wearing apparel* |
-32.9 |
11.9 |
|
Basic metals |
-15.5 |
15 |
|
Transport equipment |
-13.5 |
6.3 |
|
Food manufacturing |
-3.5 |
7.1 |
|
Beverage |
-11.5 |
27.5 |
|
Chemical products |
-5.3 |
9.4 |
|
Paper and paper products |
-19.6 |
14.5 |
|
Textile |
-10.4 |
2.9 |
|
Petroleum products |
-1.4 |
10.6 |
|
Furniture and fixtures |
-21.2 |
13.7 |
|
Nonmetallic mineral products |
-1.1 |
-1.7 |
|
Tobacco |
-1.1 |
3.0 |
|
Leather products* |
-17.1 |
27.4 |
|
Miscellaneous manufactures |
-1.7 |
11.5 |
|
Rubber products |
-0.2 |
22.4 |
Note: * - new sectors in the 1994-based series
Sectors are ranked according to their contribution to the overall 1994-based April 2004 growth rate.
Year-on-year growth rates are computed by dividing the current month index by previous year same month index less 1.
Month-on-month growth rates are computed by dividing the current month index by previous month index less 1.
Source: National Statistics Office
Manila, Philippines
| Attachment | Size |
|---|---|
|
|
60.38 KB |
|
|
29.97 KB |
|
|
43.6 KB |
|
|
23.99 KB |
|
|
28.43 KB |
|
|
7.58 KB |
|
|
6.75 KB |