
- Value of Production sustains growth in April 2012
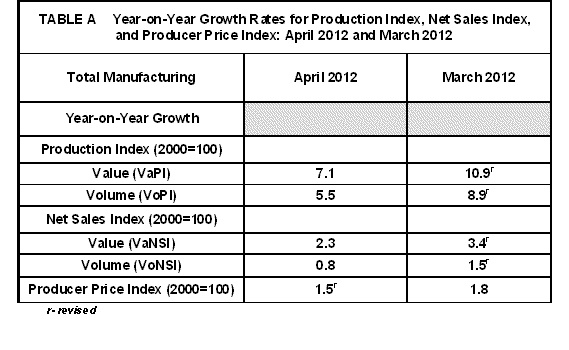
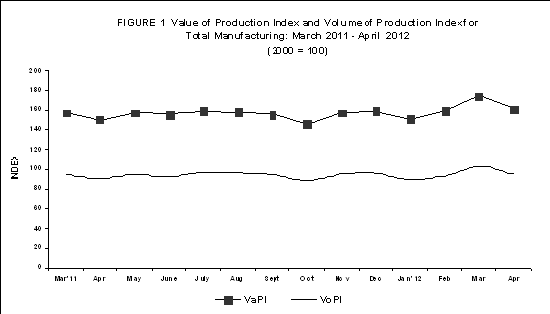
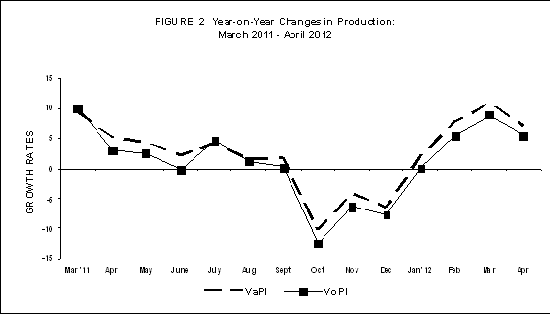
Value of Production Index (VaPI) for total manufacturing sustained a positive growth of 7.1 percent in April 2012, according to the preliminary results of the Monthly Integrated Survey of Selected Industries (MISSI). Significant contributors to the growth were registered in the following major sectors: publishing and printing (131.5%), furniture and fixtures (126.8%), footwear and wearing apparel (86.7%), wood and wood products (27.7%), leather products (22.1%), food manufacturing (16.3%), chemical products (13.8%) and rubber and plastic products (10.1%). Refer to Tables 1-A and 1.
However, on a month-on-month basis, VaPI dropped as it posted a decrement of 7.8 percent in April 2012. This was contributed by 17 major sectors, with two-digit decreases noted in the following: basic metals (-22.4%), transport equipment (-19.8%), electrical machinery (-19.3%), leather products (-17.8%), tobacco products (-16.2%), fabricated metal products (-14.2%), miscellaneous manufactures (-13.1%) and footwear and wearing apparel (-10.6%). Refer to Tables 1-A and 1.
- Volume of Production also posts a slower growth.
Volume of Production Index (VoPI) likewise registered a year-on-year increment of 5.5 percent in April 2012. Among the 13 major sectors that reported increases in VoPI, six major sectors significantly contributed to the growth, namely: furniture and fixtures (234.6%), publishing and printing (131.5%), footwear and wearing apparel (88.9%), wood and wood products (40.6%), leather products (25.7%), and chemical products (12.9%). Refer to Tables 1-B and 2.
On a month-on-month comparison, VoPI went down by 7.2 percent in April 2012. Eight of the 16 major sectors were significant contributors to the decline, namely: transport equipment (-23.1%), basic metals (-21.9%), electrical machinery (-18.5%), leather products (-17.8%), tobacco products (-16.2%), fabricated metal products (-14.2%), miscellaneous manufactures (-12.3%) and footwear and wearing apparel (-10.6%). Refer to Tables 1-B and 2.
- Value of Net Sales maintains positive growth
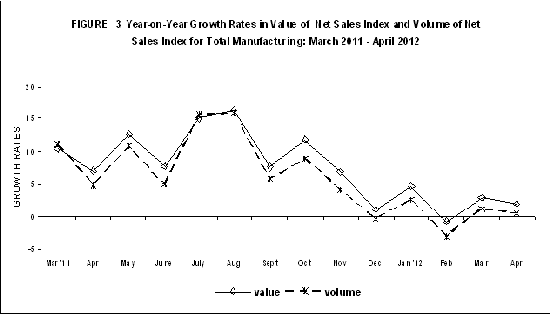
Value of Net Sales Index (VaNSI) maintained a positive growth rate registering at 2.3 percent in April 2012. Major sectors with double-digit increases were observed in the following: footwear and wearing apparel (71.8%), textiles (40.2%), wood and wood products (22.2%), tobacco products (21.5%), chemical products (19.2%), rubber and plastic products (17.4%), non-metallic mineral products (13.0%) and petroleum products (10.3%). Refer to Tables 2-A and 3.
On a monthly basis, VaNSI went down by 8.8 percent in April 2012. This was due to the decreases of 20 major sectors, with significant reductions in VoPI noted in the following: publishing and printing (-35.9%), furniture and fixtures (-27.1%), basic metals (-25.3%), leather products (-23.9%), machinery except electrical (-22.6%), fabricated metal products (-14.1%), transport equipment (-13.4%), footwear and wearing apparel (-12.9%), electrical machinery (-11.2%) and miscellaneous manufactures (-10.8%). Refer to Tables 2-A and 3.
- Volume of Net Sales likewise increases
Volume of Net Sales Index (VoNSI) also grew at a slower rate of 0.8 percent in April 2012. Eight of the 16 major sectors reported two-digit increases as follows: footwear and wearing apparel (73.8%), textiles (43.9%), furniture and fixtures (38.4%), wood and wood products (34.5%), tobacco products (22.2%), non-metallic mineral products (21.1%), chemical products (18.2%) and rubber and plastic products (11.3%). Refer to Tables 2-B and 4.
On a month-on-month change, VoNSI decreased by 8.3 percent in April 2012. This was attributed to the decreases in VoNSI reported by 20 major sectors, led by publishing and printing which exhibited the highest negative rate of 35.9 percent. Refer to Tables 2-B and 4.
- Capacity Utilization in April 2012
Average capacity utilization in April 2012 for total manufacturing stood at 83.4 percent. Twelve of the 20 major sectors registered capacity utilization rates of 80 percent or more, namely: food manufacturing (87.2%), petroleum products (87.0%), basic metals (86.6%), non-metallic mineral products (84.6%), electrical machinery (84.4%), rubber and plastic products (83.2%), chemical products (83.1%), miscellaneous manufactures (82.8%), machinery except electrical (82.6%), paper and paper products (82.1%), publishing and printing (81.0%) and wood and wood products (80.0%). Refer to Table 6.
The proportion of establishments that operated at full capacity (90% to 100%) was 21.0 percent in April 2012. About 56.2 percent of the establishments operated at 70% to 89% capacity while 22.8 percent of the establishments operated below 70% capacity.
| Below 50 percent | 3.8 | ||
| 50 percent - 59 percent | 6.7 | ||
| 60 percent - 69 percent | 12.3 | ||
| 70 percent - 79 percent | 17.9 | ||
| 80 percent - 89 percent | 38.3 | ||
| 90 percent - 100 percent | 21.0 | ||
|
Table B Distribution of Key Manufacturing Establishments |
|||
| Capacity Utilization | Percent Share | ||
|---|---|---|---|
TECHNICAL NOTES
- Introduction
The Monthly Integrated of Selected Industries (MISSI) is one of the designated statistical activities undertaken by the National Statistics Office to provide flash indicators on the performance of growth-oriented industries in the manufacturing sector. The survey gathers monthly data on employment, compensation, production, net sales, inventories and capacity utilization.
Beginning with the January 2012 MISSI, the monthly report for the survey will be released earlier, that is, 45 days after each reference month instead of the 55 days.
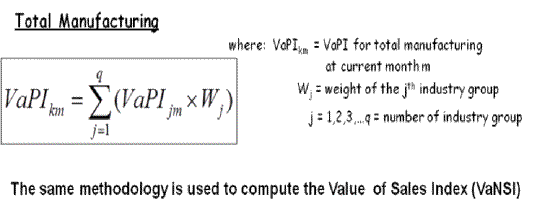
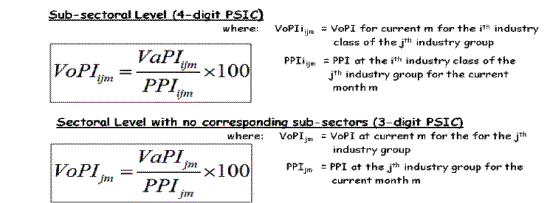
The indicators generated from the 2012 MISSI are Value of Production Index (VaPI), Volume of Production Index (VoPI), Value of Net Sales (VaNSI), and Volume of Net Sales (VoNSI). However, the VoPI and VoNSI are derived indicators utilizing the 2012 Producer Price Index as deflator.
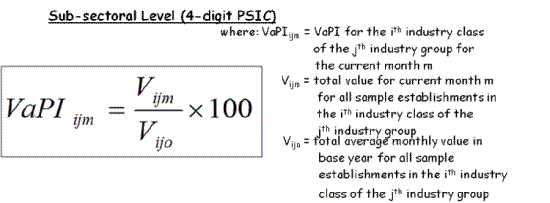
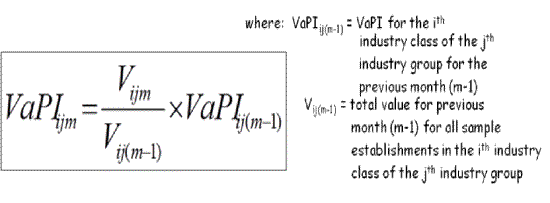
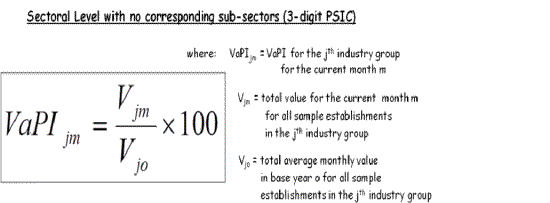
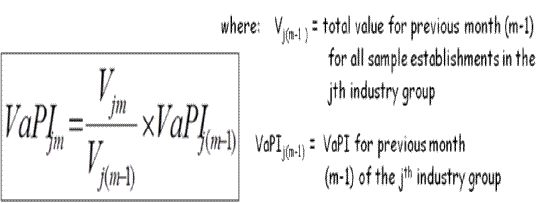
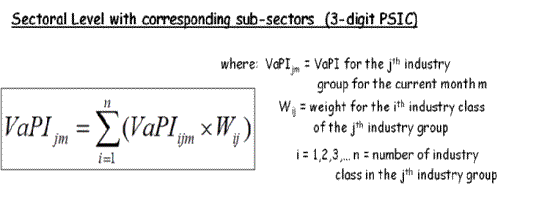
- Method of Index Computation
The MISSI utilizes the Laspeyres-type method of index computation where the weights are computed from the value of production of the Census of Philippine Business and Industry (CPBI).
For the 2012 MISSI index series with base year of 2000, the weights of the major sectors and sub-sectors were computed from the results of the 2000 CPBI for manufacturing establishments with average total employment of 20 and over. The weights are computed from the value of products sold plus change in inventories.
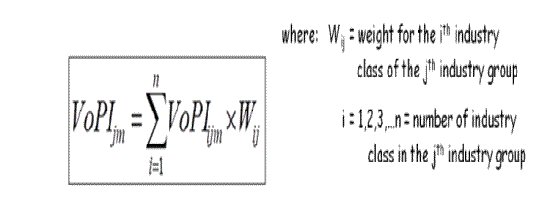
The formulas in the computation are as follows:
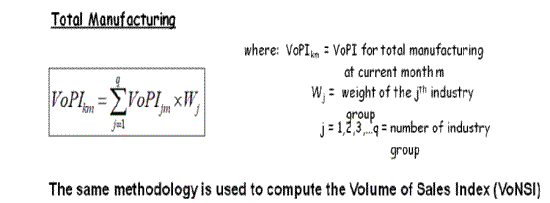
- Industry Coverage
The industry coverage of the 2012 MISSI conforms with the amended 1994 PSIC groupings. There are 20 major sectors as shown below with 10 further disaggregated into sub-sectors.
| 1994 PSIC CODE | INDUSTRY DESCRIPTION |
|---|---|
| 15 except 155 | Food Manufacturing* |
| 155 | Beverages |
| 16 | Tobacco products |
| 17 | Textiles* |
| 18,174 and 192 | Footwear and wearing apparel |
| 191 | Leather products |
| 20 | Wood and wood products* |
| 21 | Paper and paper products |
| 22 | Publishing and printing |
| 23 | Petroleum products* |
| 24 | Chemical products* |
| 25 | Rubber and plastic products* |
| 26 | Non-metallic mineral products* |
| 27 | Basic metals* |
| 28 | Fabricated metal products |
| 29 and 30 | Machinery except electrical* |
| 31 and 32 | Electrical machinery* |
| 34 and 35 | Transport equipment |
| 36 | Furniture and fixtures |
| 33, 37 and 39 | Miscellaneous manufactures |
Note: * - Major sectors categorized into sub-sectors
- Response Rate
The response rates for the April 2012 MISSI and 2012 PPS are 82.1 percent and 90.5 percent, respectively. Refer to Tables 7 and 8
| MISSI | 82.1 | 92.1r | |
| PPS | 90.5r | 93.5r | |
|
Table C Response Rates for Total Manufacturing |
|||
| April 2012 | March 2012 (revised) |
||
|---|---|---|---|
Data of non-responding sample establishments are estimated based on previous records and other available sources. Revisions to the preliminary estimated are done upon receipt of actual reports of late respondents.
| (Sgd.) CARMELITA N. ERICTA Administrator |
| Gainers | Year-on-Year Growth (%) | |
|---|---|---|
| April 2012 | March 2012 (revised) |
|
|
Food Manufacturing |
16.3 |
19.8 |
|
Footwear and Wearing Apparel |
86.7 |
96.9 |
|
Publishing and Printing |
131.5 |
44.5 |
|
Chemical Products |
13.8 |
3.5 |
|
Furniture and Fixtures |
126.8 |
76.8 |
|
Petroleum Products |
8.9 |
16.7 |
|
Electrical Machinery |
4.6 |
27.7 |
|
Machinery Except Electrical |
4.0 |
5.1 |
|
Rubber and Plastic Products |
10.1 |
10.5 |
|
Transport Equipment |
6.0 |
-9.7 |
|
Wood and Wood Products |
27.7 |
3.4 |
|
Leather Products |
22.1 |
-0.2 |
|
Beverages |
0.3 |
12.6 |
| Losers | Year-on-Year Growth (%) | |
|---|---|---|
| April 2012 | March 2012 (revised) |
|
|
Basic Metals |
-40.2 |
-21.8 |
|
Tobacco Products |
-39.6 |
29.7 |
|
Fabricated Metal Products |
-14.5 |
-20.6 |
|
Miscellaneous Manufactures |
-2.4 |
-18.0 |
|
Paper and Paper Products |
-1.8 |
-9.8 |
|
Non-Metallic Mineral Products |
-0.9 |
3.3 |
|
Textiles |
b/ |
3.0 |
| Gainers | Month-on-Month Growth (%) | |
|---|---|---|
| April 2012 | March 2012 (revised) |
|
|
Publishing and Printing |
78.7 |
12.9 |
|
Paper and Paper Products |
3.5 |
-0.3 |
|
Furniture and Fixtures |
2.6 |
4.7 |
| Losers | Month-on-Month Growth (%) | |
|---|---|---|
| April 2012 | March 2012 (revised) |
|
|
Electrical Machinery |
-19.3 |
10.8 |
|
Basic Metals |
-22.4 |
13.1 |
|
Food Manufacturing |
-5.8 |
8.2 |
|
Transport Equipment |
-19.8 |
0.7 |
|
Machinery Except Electrical |
-5.4 |
1.7 |
|
Beverages |
-8.4 |
10.3 |
|
Footwear and Wearing Apparel |
-10.6 |
7.6 |
|
Tobacco Products |
-16.2 |
7.8 |
|
Miscellaneous Manufactures |
-13.1 |
11.7 |
|
Chemical Products |
-3.5 |
16.2 |
|
Non-Metallic Mineral Products |
-7.4 |
3.6 |
|
Fabricated Metal Products |
-14.2 |
11.9 |
|
Petroleum Products |
-1.9 |
10.2 |
|
Textiles |
-4.5 |
2.6 |
|
Rubber and Plastic Products |
-2.8 |
2.8 |
|
Leather Products |
-17.8 |
12.0 |
|
Wood and Wood Products |
-0.3 |
21.5 |
Notes:
b/ - Less than 0.1 percent decrease
Sectors are ranked according to their contribution to the overall 2000-based April 2012 growth rate.
Year-on-year growth rates are computed by dividing the current month index by previous year same month index less 1.
Month-on-month growth rates are computed by dividing the current month index by previous month index less 1.
| Gainers | Year-on-Year Growth (%) | |
|---|---|---|
| April 2012 | March 2012 (revised) |
|
|
Footwear and Wearing Apparel |
88.9 |
95.9 |
|
Furniture and Fixtures |
234.6 |
102.0 |
|
Food Manufacturing |
9.2 |
10.8 |
|
Publishing and Printing |
131.5 |
44.5 |
|
Electrical Machinery |
5.8 |
30.0 |
|
Chemical Products |
12.9 |
4.4 |
|
Petroleum Products |
3.3 |
2.1 |
|
Wood and Wood Products |
40.6 |
13.8 |
|
Non-Metallic Mineral Products |
6.2 |
9.4 |
|
Rubber and Plastic Products |
4.5 |
4.3 |
|
Leather Products |
25.7 |
2.7 |
|
Textiles |
2.6 |
5.5 |
|
Beverages |
0.3 |
11.5 |
| Losers | Year-on-Year Growth (%) | |
|---|---|---|
| April 2012 | March 2012 (revised) |
|
|
Basic Metals |
-36.6 |
-17.8 |
|
Tobacco Products |
-39.2 |
30.4 |
|
Fabricated Metal Products |
-13.5 |
-15.3 |
|
Machinery Except Electrical |
-1.0 |
1.4 |
|
Paper and Paper Products |
-2.6 |
-10.0 |
|
Miscellaneous Manufactures |
-2.9 |
-17.4 |
|
Transport Equipment |
-0.8 |
-10.2 |
| Gainers | Month-on-Month Growth (%) | ||||||
|---|---|---|---|---|---|---|---|
| April 2012 | March 2012 (revised) |
||||||
|
Publishing and Printing |
78.7 |
12.9 |
|||||
|
Petroleum Products |
3.5 |
5.0 |
|||||
|
Furniture and Fixtures |
28.3 |
-5.5 |
|||||
|
Paper and Paper Products |
3.6 |
1.0 |
|||||
|
|||||||
|
Electrical Machinery |
-18.5 |
13.7 |
|||||
|
Transport Equipment |
-23.1 |
2.6 |
|||||
|
Basic Metals |
-21.9 |
13.7 |
|||||
|
Food Manufacturing |
-5.6 |
8.1 |
|||||
|
Machinery Except Electrical |
-6.4 |
5.0 |
|||||
|
Chemical Products |
-5.7 |
16.2 |
|||||
|
Beverages |
-8.4 |
10.3 |
|||||
|
Footwear and Wearing Apparel |
-10.6 |
7.6 |
|||||
|
Tobacco Products |
-16.2 |
7.8 |
|||||
|
Miscellaneous Manufactures |
-12.3 |
9.7 |
|||||
|
Fabricated Metal Products |
-14.2 |
13.1 |
|||||
|
Non-Metallic Mineral Products |
-5.5 |
2.6 |
|||||
|
Rubber and Plastic Products |
-2.7 |
3.0 |
|||||
|
Textiles |
-3.9 |
2.5 |
|||||
|
Leather Products |
-17.8 |
10.7 |
|||||
|
Wood and Wood Products |
-0.3 |
20.5 |
|||||
Notes
Sectors are ranked according to their contribution to the overall 2000-based April 2012 growth rate.
Year-on-year growth rates are computed by dividing the current month index by previous year same month index less 1.
Month-on-month growth rates are computed by dividing the current month index by previous month index less 1.
| Gainers | Year-on-Year Growth (%) | |
|---|---|---|
| April 2012 | March 2012 (revised) |
|
|
Footwear and Wearing Apparel |
71.8 |
81.8 |
|
Chemical Products |
19.2 |
9.9 |
|
Food Manufacturing |
8.9 |
4.0 |
|
Petroleum Products |
10.3 |
12.4 |
|
Textiles |
40.2 |
9.6 |
|
Machinery Except Electrical |
6.0 |
29.9 |
|
Electrical Machinery |
3.0 |
1.6 |
|
Tobacco Products |
21.5 |
0.2 |
|
Non-Metallic Mineral Products |
13.0 |
8.38 |
|
Transport Equipment |
8.0 |
2.3 |
|
Beverages |
5.9 |
13.2 |
|
Rubber and Plastic Products |
17.4 |
11.6 |
|
Miscellaneous Manufactures |
8.9 |
-4.8 |
|
Wood and Wood Products |
22.2 |
12.5 |
| Losers | Year-on-Year Growth (%) | |
|---|---|---|
| April 2012 | March 2012 (revised) |
|
|
Basic Metals |
-54.5 |
-36.1 |
|
Publishing and Printing |
-26.8 |
40.3 |
|
Fabricated Metal Products |
-8.5 |
-7.5 |
|
Paper and Paper Products |
-5.7 |
-10.0 |
|
Furniture and Fixtures |
-6.2 |
-6.0 |
|
Leather Products |
-2.0 |
8.7 |
| Losers | Month-on-Month Growth (%) | |
|---|---|---|
| April 2012 | March 2012 (revised) |
|
|
Machinery Except Electrical |
-22.6 |
16.8 |
|
Electrical Machinery |
-11.2 |
12.2 |
|
Basic Metals |
-25.3 |
26.0 |
|
Food Manufacturing |
-3.5 |
5.6 |
|
Petroleum Products |
-5.5 |
12.1 |
|
Transport Equipment |
-13.4 |
7.6 |
|
Beverages |
-9.7 |
22.0 |
|
Chemical Products |
-5.0 |
11.8 |
|
Publishing and Printing |
-35.9 |
6.7 |
|
Footwear and Wearing Apparel |
-12.9 |
10.1 |
|
Miscellaneous Manufactures |
-10.8 |
7.8 |
|
Furniture and Fixtures |
-27.1 |
5.1 |
|
Fabricated Metal Products |
-14.1 |
10.9 |
|
Non-Metallic Mineral Products |
-5.5 |
17.2 |
|
Tobacco Products |
-8.1 |
5.8 |
|
Textiles |
-7.2 |
-19.5 |
|
Paper and Paper Products |
-4.9 |
4.3 |
|
Leather Products |
-23.9 |
10.7 |
|
Rubber and Plastic Products |
-2.0 |
0.4 |
|
Wood and Wood Products |
-2.5 |
28.7 |
Sectors are ranked according to their contribution to the overall 2000-based April 2012 growth rate.
Year-on-year growth rates are computed by dividing the current month value of net sales by previous year same month value of net sales less 1.
Month-on-month growth rates are computed by dividing the current month value of net sales by previous month value of net sales less 1.
| Gainers | Year-on-Year Growth (%) | ||||||
|---|---|---|---|---|---|---|---|
| April 2012 | March 2012 (revised) |
||||||
|
Footwear and Wearing Apparel |
73.8 |
80.9 |
|||||
|
Chemical Products |
18.2 |
10.8 |
|||||
|
Textiles |
43.9 |
12.3 |
|||||
|
Electrical Machinery |
4.2 |
3.4 |
|||||
|
Non-Metallic Mineral Products |
21.1 |
14.7 |
|||||
|
Petroleum Products |
4.6 |
-1.7 |
|||||
|
Tobacco Products |
22.2 |
0.8 |
|||||
|
Food Manufacturing |
2.3 |
-3.8 |
|||||
|
Furniture and Fixtures |
38.4 |
7.3 |
|||||
|
Beverages |
5.9 |
12.1 |
|||||
|
Wood and Wood Products |
34.5 |
23.9 |
|||||
|
Miscellaneous Manufactures |
8.3 |
-4.1 |
|||||
|
Rubber and Plastic Products |
11.3 |
5.5 |
|||||
|
Machinery Except Electrical |
0.9 |
25.3 |
|||||
|
Transport Equipment |
1.0 |
1.8 |
|||||
|
Leather Products |
0.8 |
11.9 |
|||||
|
|||||||
|
Basic Metals |
-51.8 |
-32.9 |
|||||
|
Publishing and Printing |
-26.8 |
40.3 |
|||||
|
Paper and Paper Products |
-6.5 |
-10.3 |
|||||
|
Fabricated Metal Products |
-7.4 |
-1.3 |
|||||
| Losers | Month-on-Month Growth (%) | |
|---|---|---|
| April 2012 | March 2012 (revised) |
|
|
Machinery Except Electrical |
-23.4 |
20.6 |
|
Electrical Machinery |
-10.3 |
15.1 |
|
Basic Metals |
-24.8 |
26.7 |
|
Transport Equipment |
-16.9 |
9.7 |
|
Chemical Products |
-7.1 |
11.9 |
|
Food Manufacturing |
-3.3 |
5.5 |
|
Beverages |
-9.7 |
22.0 |
|
Publishing and Printing |
-35.9 |
6.8 |
|
Footwear and Wearing Apparel |
-12.9 |
10.1 |
|
Fabricated Metal Products |
-14.1 |
12.1 |
|
Miscellaneous Manufactures |
-10.0 |
5.9 |
|
Tobacco Products |
-8.1 |
5.8 |
|
Textiles |
-6.6 |
-19.6 |
|
Non-Metallic Mineral Products |
-3.5 |
16.0 |
|
Paper and Paper Products |
-4.7 |
5.7 |
|
Furniture and Fixtures |
-8.9 |
-5.2 |
|
Leather Products |
-24.0 |
9.4 |
|
Petroleum Products |
-0.3 |
6.9 |
|
Rubber and Plastic Products |
-1.8 |
0.5 |
|
Wood and Wood Products |
-2.5 |
27.6 |
Note:
Sectors are ranked according to their contribution to the overall 2000-based April 2012 growth rate.
Year-on-year growth rates are computed by dividing the current month volume of net sales by previous year same month volume of net sales less 1.
Month-on-month growth rates are computed by dividing the current month volume of net sales by previous month volume of net sales less 1.
Source: National Statistics Office
Manila, Philippines