
|
Table A Year-on-Year Growth Rates for Production Index, Net Sales Index and Producer Price Index: April 2014 and April 2013 |
||
|---|---|---|
|
TOTAL MANUFACTURING |
APRIL
2014
|
APRIL
2013
|
|
YEAR-ON-YEAR GROWTH |
|
|
|
Production Index (2000=100) |
|
|
|
Value (VaPI) |
12.9 |
-1.5r |
|
Volume (VoPI) |
12.8 |
9.0r |
|
Net Sales Index (2000=100) |
|
|
|
Value (VaNSI) |
0.3 |
12.2r |
|
Volume (VoNSI) |
0.2 |
24.2r |
|
Producer Price Index (2000=100) |
0.1r |
-9.6 |
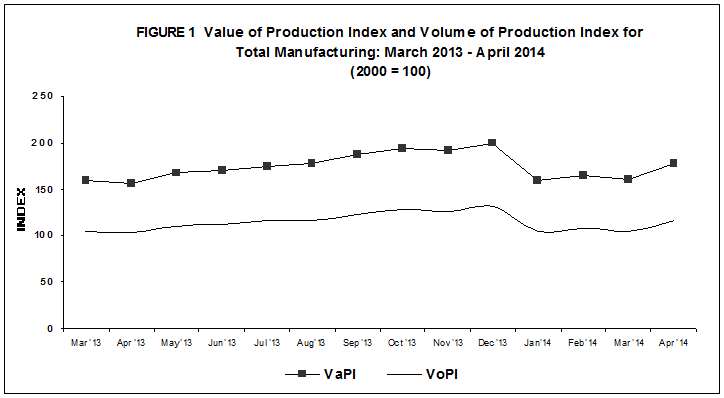
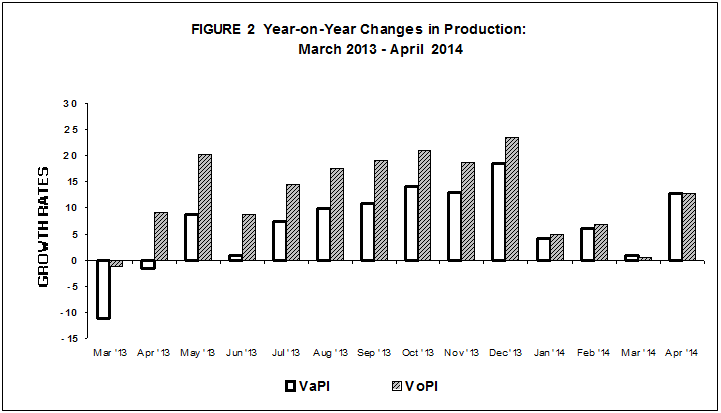
- Value of Production Index expands in April 2014
Value of Production Index (VaPI) for manufacturing grew by 12.9 percent in April 2014 compared with a negative 1.5 percent in April 2013, according to the preliminary results of the Monthly Integrated Survey of Selected Industries (MISSI). This is due to the strong performance of petroleum products which bounced back and posted a three-digit growth of 159.9 percent. Other sectors that significantly contributed to the positive performance of VAPI were: printing (96.8%), machinery except electrical (84.1%), tobacco products (77.8%), fabricated metal products (38.1%) and beverages (31.4%). Refer to Tables 1-A and 1.
- Volume of Production Index increases in April 2014
Volume of Production Index (VoPI) posted an increment of 12.8 percent in April 2014 from 9.0 percent in April 2013. Petroleum products (128.7%) led the sectors that contributed to the performance of VoPI. Other major sectors that pulled-up the VoPI were the following: printing (96.8%), machinery except electrical (90.7%), tobacco products (78.2%), fabricated metal products (43.1%), beverages (30.7%) and furniture and fixtures (12.6%). Refer to Tables 1-B and 2.
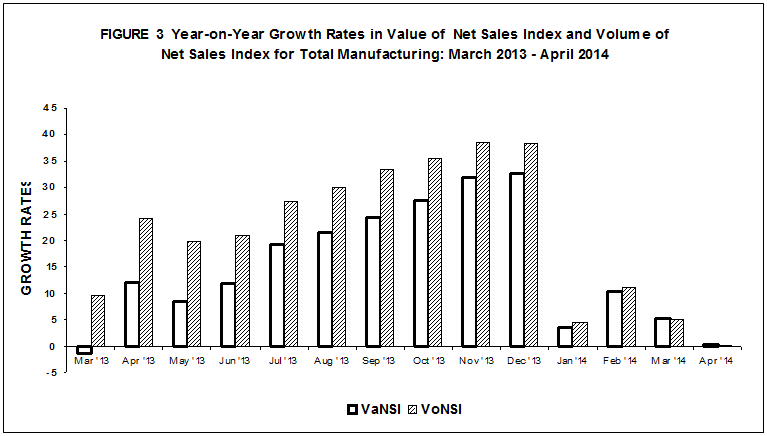
- Value of Net Sales Index manifests a single-digit growth in April 2014
Value of Net Sales Index (VaNSI), went up by 0.3 percent in April 2014 compared 12.2 percent in April 2013. Ten major sectors contributed to the increase with four sectors posting double-digit increments. These were the following: printing (79.9%), fabricated metal products (68.8%), textiles (21.5%) and petroleum products (21.4%). Refer to Tables 2-A and 3.
- Volume of Net Sales Index increases in April 2014
Volume of Net Sales Index (VoNSI) likewise gained a minimal 0.2 percent in April 2014 compared with 24.2 percent during the same period last year. Four out of nine major sectors that posted increments significantly pulled up VoNSI. These were: printing (79.9%), fabricated metal products (75.0%), textiles (18.7%) and furniture and fixtures (15.7%). Refer to Tables 2-B and 4.
- Capacity Utilization in April 2014 is 83.4 percent
Average capacity utilization in April 2014 for total manufacturing stood at 83.4 percent. More than 50 percent or eleven of the 20 major industries operated at 80 percent and above capacity utilization rates. These are:
- petroleum products (88.7%)
- basic metals (87.6%)
- non-metallic mineral products (86.1%)
- machinery except electrical (85.0%)
- food manufacturing (84.5 %)
- electrical machinery (84.4%)
- chemical products (83.9%)
- paper and paper products (82.8%)
- rubber and plastic products (82.3%)
- wood and wood products (81.2%)
- publishing and printing (80.4%)
The proportion of establishments that operated at full capacity (90% to 100%) was 24.1 percent in April 2014. About 56.7 percent of the establishments operated at 70% to 89% capacity while 19.2 percent of the establishments operated below 70% capacity. Refer to Table 6.
|
Table B Distribution of Key Manufacturing Establishments by Capacity Utilization for Total Manufacturing: April 2014 |
|
|---|---|
|
Capacity Utilization |
Percent Share |
|
Below 50% |
3.8 |
|
50% - 59% |
5.8 |
|
60% - 69% |
9.6 |
|
70% - 79% |
24.2 |
|
80% - 89% |
32.5 |
|
90% - 100% |
24.1 |
- Response Rate
The response rates for the April 2014 MISSI and PPS are 87.0 percent and 91.1 percent, respectively. Refer to Tables 7 and 8.
|
Table C Response Rates For Total Manufacturing
(In percent)
|
||
|---|---|---|
|
April 2014 |
March 2014
(Revised)
|
|
|
MISSI |
87.0 |
95.6r |
|
PPS |
91.1 |
97.8r |
Data of non-responding samples were estimated based on previous records and other administrative reports of these establishments. Revisions to the preliminary estimates are done upon receipt of actual reports of late respondents.
|
Gainers |
Year-on-Year Growth (%) |
|
|---|---|---|
| April 2014 |
March 2014
(revised)
|
|
|
Petroleum products |
159.9 |
-42.0 |
|
Machinery except electrical |
84.1 |
77.2 |
|
Tobacco products |
77.8 |
109.1 |
|
Electrical machinery |
8.1 |
11.7 |
|
Beverages |
31.4 |
30.4 |
|
Printing |
96.8 |
148.8 |
|
Fabricated metal products |
38.1 |
46.1 |
|
Food manufacturing |
2.2 |
4.8 |
|
Textiles |
8.9 |
45.2 |
|
Transport equipment |
2.9 |
13.6 |
|
Leather products |
3.7 |
0.3 |
|
Losers |
Year-on-Year Growth (%) |
|
|---|---|---|
| April 2014 |
March 2014
(revised)
|
|
|
Basic metals |
-20.8 |
-26.0 |
|
Non-metallic mineral products |
-12.2 |
-11.7 |
|
Footwear and wearing apparel |
-11.5 |
-9.8 |
|
Rubber and plastic products |
-9.3 |
0.6 |
|
Miscellaneous manufactures |
-12.4 |
4.9 |
|
Chemical products |
-2.4 |
-14.8 |
|
Furniture and fixtures |
-18.8 |
-12.0 |
|
Paper and paper products |
-7.1 |
8.7 |
|
Wood and wood products |
-2.1 |
-22.2 |
|
Gainers |
Year-on-Year Growth (%) |
|
|---|---|---|
| April 2014 |
March 2014
(revised)
|
|
|
Petroleum products |
128.7 |
-47.2 |
|
Machinery except electrical |
90.7 |
96.4 |
|
Tobacco products |
78.2 |
109.6 |
|
Beverages |
30.7 |
29.8 |
|
Printing |
96.8 |
148.8 |
|
Electrical machinery |
4.0 |
4.7 |
|
Fabricated metal products |
43.1 |
53.4 |
|
Textiles |
6.5 |
44.8 |
|
Furniture and fixtures |
12.6 |
3.9 |
|
Transport equipment |
1.3 |
14.4 |
|
Leather products |
0.5 |
-2.9 |
|
Losers |
Year-on-Year Growth (%) |
|
|---|---|---|
| April 2014 |
March 2014
(revised)
|
|
|
Basic metals |
-12.2 |
-19.1 |
|
Non-metallic mineral products |
-15.2 |
-13.4 |
|
Food manufacturing |
-2.0 |
0.6 |
|
Footwear and wearing apparel |
-10.7 |
-10.4 |
|
Rubber and plastic products |
-11.6 |
-1.2 |
|
Miscellaneous manufactures |
-10.8 |
2.6 |
|
Paper and paper products |
-9.6 |
5.7 |
|
Chemical products |
-2.1 |
-14.8 |
|
Wood and wood products |
-4.9 |
-24.7 |
|
Gainers |
Year-on-Year Growth (%) |
|
|---|---|---|
| April 2014 |
March 2014
(revised)
|
|
|
Petroleum products |
21.4 |
16.9 |
|
Fabricated metal products |
68.8 |
82.4 |
|
Printing |
79.9 |
116.7 |
|
Electrical machinery |
3.7 |
12.8 |
|
Textiles |
21.5 |
41.5 |
|
Machinery except electrical |
3.5 |
16.2 |
|
Paper and paper products |
8.1 |
22.9 |
|
Tobacco products |
2.0 |
23.4 |
|
Non-metallic mineral products |
0.9 |
20.0 |
|
Leather products |
9.0 |
-17.3 |
|
Losers |
Year-on-Year Growth (%) |
|
|---|---|---|
| April 2014 |
March 2014
(revised)
|
|
|
Food manufacturing |
-7.0 |
2.1 |
|
Basic metals |
-17.0 |
-23.6 |
|
Beverages |
-11.7 |
-2.6 |
|
Footwear and wearing apparel |
-22.3 |
-15.3 |
|
Chemical products |
-5.0 |
-6.0 |
|
Transport equipment |
-5.2 |
1.2 |
|
Miscellaneous manufactures |
-8.0 |
1.4 |
|
Furniture and fixtures |
-16.6 |
-7.9 |
|
Rubber and plastic products |
-5.0 |
10.5 |
|
Wood and wood products |
-1.6 |
-23.1 |
|
Gainers |
Year-on-Year Growth (%) |
|
|---|---|---|
| April 2014 |
March 2014
(revised)
|
|
|
Fabricated metal products |
75.0 |
91.5 |
|
Printing |
79.9 |
116.7 |
|
Petroleum products |
6.9 |
6.3 |
|
Machinery except electrical |
7.2 |
28.7 |
|
Textiles |
18.7 |
41.1 |
|
Furniture and fixtures |
15.7 |
8.7 |
|
Paper and paper products |
5.1 |
19.6 |
|
Tobacco products |
2.3 |
23.7 |
|
Leather products |
5.6 |
-20.0 |
|
Losers |
Year-on-Year Growth (%) |
|
|---|---|---|
| April 2014 |
March 2014
(revised)
|
|
|
Food manufacturing |
-10.8 |
-2.0 |
|
Beverages |
-12.2 |
-3.1 |
|
Footwear and wearing apparel |
-21.6 |
-15.9 |
|
Chemical products |
-4.7 |
-6.0 |
|
Basic metals |
-8.0 |
-16.5 |
|
Transport equipment |
-6.6 |
1.9 |
|
Miscellaneous manufactures |
-6.4 |
-0.8 |
|
Rubber and plastic products |
-7.4 |
8.5 |
|
Non-metallic mineral products |
-2.6 |
17.6 |
|
Electrical machinery |
-0.2 |
5.8 |
|
Wood and wood products |
-4.5 |
-25.5 |