
| Total manufacturing | August 2003 | July 2003 |
| Year-on-Year Growth | ||
| Production Index | ||
| Value(VaPI) | 11.9 | 13.1r |
| Volume(VoPI) | 7.0 | 4.5r |
| Net Sales Index | ||
| Value | 16.1 | 10.3r |
| Volume | 9.3 | 1.4r |
| Producers Price Index | 4.6 | 8.2 |
| Average Capacity Utilization | 78.6 | 78.8r |
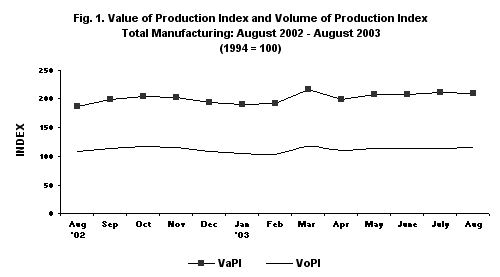
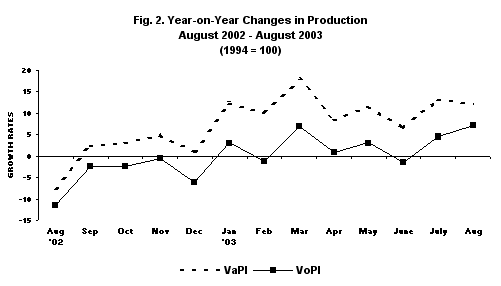
· Value of Production Index (VaPI) continues to gain
Value of Production Index (VaPI) of the manufacturing industry posted an 11.9 percent growth in August 2003 compared with year-ago figure, according to the preliminary results of the Monthly Integrated Survey of Selected Industries (MISSI). Basic metals topped all sectors with the highest growth of 138.2 percent. Other sectors which also exhibited double-digit increases in production were: petroleum products, machinery excluding electrical, miscellaneous manufactures, textile and paper and paper products (see Table 1-A).
On the other hand, monthly VaPI reported a slide of 0.5 percent in August 2003 from the previous month�s (revised) 1.9 percent growth. This was brought about by the sluggish performance ofleather products and chemical products sectors (see Table 1-A).
· Volume of Production Index (VoPI) registers growth
Volume of Production Index (VoPI) gained further on a year-on-year basis with 7.0 percent growth in August 2003. Basic metals which surged by 121.4 percent led the sectors that reflected double-digit increases. Other major contributors to the increase were the following: wood and wood products, machinery excluding electrical, petroleum products, miscellaneous manufactures and textile (see Table 1-B).
Likewise, VoPI on a monthly basis rose by 1.8 percent in August 2003. Major contributors to the increase were tobacco and electrical machinery sectors (see Annex 1-B).
· Value of Net Sales moves up
Value of Net Sales in August 2003 appreciably improved by 16.1 percent compared to the previous month�s year-on-year increase of 10.3 percent. Significant increments were depicted in the following sectors: machinery excluding electrical, basic metals, electrical machinery, petroleum products, textile, nonmetallic mineral products, publishing and printing, chemical products and miscellaneous manufactures <>(see Table 2-A).
Compared to the previous month, Value of Net Sales similarly grew by 3.2 percent in August 2003. Major contributor to the increase was electrical machinery sector (see Table 2-A).
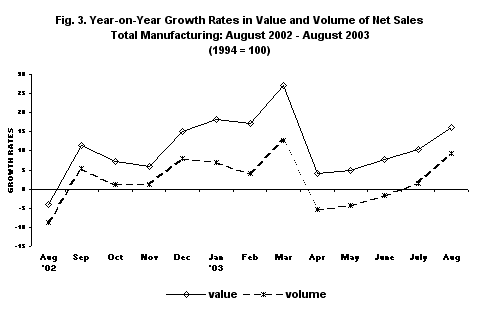
· Net Sales Volume exhibits increasing trend
Net Sales Volume exhibited a 9.3 percent growth in August 2003 compared with year-ago figure. Sectors that contributed to this increase were machinery excluding electrical, electrical machinery, wood and wood products, basic metals, petroleum products, nonmetallic mineral products, textile, publishing and printing and miscellaneous manufactures (see Table 2-B).
On a month-on-month basis, Volume of Net Sales registered an increase of 4.8 percent in August 2003. This was due to the notable growth of electrical machinery sector. (see Table 2-B).
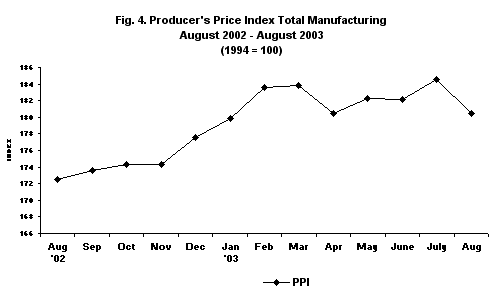
· Producer's Price Index (PPI) appreciates at a slower rate
Producer's Price Index (PPI) for total manufacturing on a year-on-year comparison posted an increase of 4.6 percent in August 2003. Chemical products topped all sectors with an increase of 21.8 percent. Other sectors that posted double-digit increases were: footwear and wearing apparel, paper and paper products, petroleum products and leather products (see Table 5).
On a monthly basis, PPI for total manufacturing went down by 2.2 percent in August 2003. Sectors that contributed to the decrease were: electrical machinery, nonmetallic mineral products, textile and miscellaneous manufactures (see Table 5).
· Capacity Utilization
Average capacity utilization in August 2003 for total manufacturing was estimated at 78.6 percent. Sectors that posted more than 80% capacity utilization rate were the following: machinery excluding electrical, miscellaneous manufactures, petroleum products, paper and paper products, electrical machinery, footwear and wearing apparel and textile(see Table 6).
The proportion of responding establishments that operated at full capacity (90%-100%) in August 2003 was 15.9 percent. About 48.5 percent of the responding establishments operated at 70%-89% capacity and 35.6 percent of the establishments operated below 70% capacity.
Distribution of Key Manufacturing Establishments
by Capacity Utilization
Total Manufacturing, August 2003
(In percent)
|
Capacity Utilization |
1994-based |
|
Below 50 percent |
13.1 |
|
50 percent - 59 percent |
7.7 |
|
60 percent - 69 percent |
14.8 |
|
70 percent - 79 percent |
21.5 |
|
80 percent - 89 percent |
27.0 |
|
90 percent - 100 percent |
15.9 |
Note: Details may not add up to 100 due to rounding.
· Response Rate
The response rate for August 2003 is 84.5 percent, which corresponds to the retrieval of 470 sample establishments reports <="" i="">.
Response Rates for Total Manufacturing
(In percent)
|
August 2003 |
July 2003(revised) |
|
84.5 |
92.6 |
· Technical Notes
Data of nonresponding sample establishments are estimated based on previous records and other available sources. Revisions to the preliminary estimates are done upon receipt of actual reports of late respondents.
|
(Sgd.) CARMELITA N. ERICTA |
TABLE 1-A. VALUE OF PRODUCTION INDEX, JULY AUGUST 2003
(1994 =100)
|
Gainers |
Year-on-Year Growth (percent) |
|
|
August 2003 |
July 2003 |
|
|
Basic metals |
138.2 |
147.9 |
|
Petroleum products |
43.1 |
21.6 |
|
Food manufacturing |
7.4 |
14.2 |
|
Machinery, excluding electrical* |
36.8 |
51.1 |
|
Textile |
12.9 |
22.1 |
|
Electrical machinery |
3.2 |
9.5 |
|
Paper and paper products |
11.3 |
10.0 |
|
Miscellaneous manufactures |
17.8 |
22.5 |
|
Publishing and printing* |
7.7 |
1.7 |
|
Beverage |
1.5 |
-5.9 |
|
Wood and wood products |
4.9 |
25.9 |
|
Rubber products |
2.0 |
13.5 |
|
|
||
|
Losers |
Year-on-Year Growth (percent) |
|
|
August 2003 |
July 2003 |
|
|
Tobacco |
-35.7 |
-61.9 |
|
Transport equipment |
-9.1 |
-11.5 |
|
Footwear and wearing apparel |
-6.5 |
5.9 |
|
Fabricated metal products* |
-9.6 |
-12.9 |
|
Nonmetallic mineral products |
-4.5 |
17.7 |
|
Chemical products |
-1.0 |
16.6 |
|
Leather products |
-48.3 |
-24.8 |
|
Furniture and fixtures |
-2.3 |
7.4 |
TABLE 1-A. VALUE OF PRODUCTION INDEX, JULY - AUGUST 2003 (concluded)
(1994=100)
|
Gainers |
Month-on-Month Growth (percent) |
|
|
August 2003 |
July 2003 |
|
|
Petroleum products |
7.9 |
3.1 |
|
Food manufacturing |
2.9 |
-1.9 |
|
Tobacco |
15.3 |
16.3 |
|
Fabricated metal products* |
9.3 |
-8.3 |
|
Publishing and printing* |
8.5 |
-2.0 |
|
Textile |
3.3 |
2.0 |
|
Paper and paper products |
5.0 |
-8.0 |
|
Machinery, excluding electrical* |
3.5 |
0.2 |
|
|
||
|
Losers |
Month-on-Month Growth (percent) |
|
|
August 2003 |
July 2003 |
|
|
Chemical products |
-11.4 |
1.7 |
|
Footwear and wearing apparel* |
-8.8 |
2.0 |
|
Beverage |
-5.7 |
-14.8 |
|
Nonmetallic mineral products |
-7.9 |
-6.3 |
|
Electrical machinery |
-2.4 |
14.0 |
|
Transport equipment |
-1.5 |
7.2 |
|
Basic metals |
-1.1 |
2.2 |
|
Wood and wood products |
-5.3 |
-10.9 |
|
Leather products* |
-28.9 |
42.0 |
|
Miscellaneous manufactures |
-0.8 |
3.7 |
|
Furniture and fixtures |
-1.3 |
-3.8 |
|
Rubber products |
-0.8 |
-11.8 |
Note: * - new sectors in the 1994-based series
Sectors are ranked according to their contribution to the overall 1994-based August 2003 growth rate.
Year-on-year growth rates are computed by dividing the current month index by previous year same month index less 1.
Month-on-month growth rates are computed by dividing the current month index by previous month index less 1.
TABLE 1-B. VOLUME OF PRODUCTION INDEX, JULY - AUGUST 2003
(1994 = 100)
|
Gainers |
Year-on-Year Growth (percent) |
|
|
August 2003 |
July 2003< |
|
|
Basic metals |
121.4 |
130.6 |
|
Petroleum products |
26.3 |
5.1 |
|
Wood and wood products |
49.8 |
58.5 |
|
Machinery, excluding electrical* |
35.2 |
49.3 |
|
Food manufacturing |
2.1 |
8.4 |
|
Textile |
10.9 |
19.1 |
|
Miscellaneous manufactures |
12.5 |
15.5 |
|
Publishing and printing* |
7.7 |
1.7 |
|
Electrical machinery |
6.4 |
-5.7 |
|
Rubber products |
8.6 |
21.2 |
|
|
||
|
Losers |
Year-on-Year Growth (percent) |
|
|
August 2003 |
July 2003 |
|
|
Chemical products |
-18.7 |
-3.6 |
|
Tobacco |
-35.8 |
-61.9 |
|
Footwear and wearing apparel* |
-22.4 |
-5.1 |
|
Transport equipment |
-10.2 |
-12.3 |
|
Fabricated metal products* |
-11.3 |
-14.6 |
|
Nonmetallic mineral products* |
-5.3 |
18.2 |
|
Paper and paper products |
-5.9 |
-8.1 |
|
Beverage |
-1.7 |
-9.5 |
|
Leather products* |
-53.3 |
-32.0 |
|
Furniture and fixtures |
-5.8 |
4.1 |
TABLE 1-B. VOLUME OF PRODUCTION INDEX, JULY - AUGUST 2003
(concluded)
(1994=100)
|
Gainers |
Month-on-Month Growth (percent) |
|
|
August 2003 |
July 20033 |
|
|
Food manufacturing |
2.8 |
-2.9 |
|
Tobacco |
15.3 |
16.3 |
|
Petroleum products |
3.6 |
3.1 |
|
Electrical machinery |
13.4 |
7.7 |
|
Textile |
3.9 |
4.1 |
|
Publishing and printing* |
8.5 |
-2.0 |
|
Paper and paper products |
5.0 |
-8.0 |
|
Machinery, excluding electrical* |
3.5 |
0.2 |
|
Fabricated metal products* |
9.3 |
-9.0 |
|
|
||
|
Losers |
Month-on-Month Growth (percent) |
|
|
August 2003 |
July 2003 |
|
|
Chemical products |
-12.2 |
2.5 |
|
Footwear and wearing apparel* |
-14.7 |
4.6 |
|
Beverage |
-5.7 |
-15.0 |
|
Nonmetallic mineral products |
-4.9 |
-10.4 |
|
Transport equipment |
-1.5 |
-6.7 |
|
Wood and wood products |
-5.3 |
-10.3 |
|
Leather products* |
-28.9 |
42.0 |
|
Furniture and fixtures |
-2.5 |
-3.5 |
|
Miscellaneous manufactures |
-0.7 |
3.6 |
|
Rubber products |
-1.0 |
12.0 |
|
Basic metals |
-1.2 |
2.1 |
Note: * - new sectors in the 1994-based series
Sectors are ranked according to their contribution to the overall 1994-based August 2003 growth rate.
Year-on-year growth rates are computed by dividing the current month index by previous year same month index less 1.
Month-on-month growth rates are computed by dividing the current month index by previous month index less 1.
TABLE 2-A. VALUE OF NET SALES, JULY - AUGUST 2003
(1994=100)
|
Gainers |
Year-on-Year Growth (percent) |
|
|
August 2003 |
July 2003 |
|
|
Electrical machinery |
52.3 |
-10.9 |
|
Petroleum products |
30.8 |
22.6 |
|
Basic metals |
53.0 |
34.5 |
|
Chemical products |
12.6 |
13.8 |
|
Machinery, excluding electrical* |
64.7 |
70.6 |
|
Food manufacturing |
3.4 |
16.1 |
|
Nonmetallic mineral products |
16.0 |
22.5 |
|
Textile |
17.2 |
27.8 |
|
Publishing and printing* |
13.3 |
29.5 |
|
Miscellaneous manufactures |
10.7 |
9.8 |
|
Wood and wood products |
5.5 |
7.8 |
|
Furniture and fixtures |
1.1 |
8.9 |
|
|
||
|
Losers |
Year-on-Year Growth (percent) |
|
|
August 2003 |
July 2003 |
|
|
Tobacco |
-30.9 |
-38.4 |
|
Transport equipment |
-7.9 |
-8.1 |
|
Footwear and wearing apparel* |
-5.3 |
11.2 |
|
Fabricated metal products* |
-10.9 |
-8.8 |
|
Rubber products |
-24.9 |
-7.1 |
|
Paper and paper products |
-5.3 |
-2.8 |
|
Beverage |
-1.4 |
-4.7 |
|
Leather products* |
-44.1 |
-11.0 |
TABLE 2-A. VALUE OF NET SALES, JULY - AUGUST 2003 (concluded)
(1994=100)
|
Gainers |
Month-on-Month Growth (percent) |
|
|
August 2003 |
July 2003 |
|
|
Electrical machinery |
29.8 |
20.7 |
|
Petroleum peoducts |
4.7 |
-2.1 |
|
Tobacco |
9.3 |
-6.7 |
|
Machinery, excluding electrical* |
8.3 |
-2.4 |
|
Textile |
1.6 |
15.0 |
|
Beverage |
0.3 |
-23.9 |
|
Fabricated metal products* |
0.3 |
-2.3 |
|
Miscellaneous manufactures |
1/ |
5.6 |
|
|
||
|
Losers |
Month-on-Month Growth (percent) |
|
|
August 2003 |
July 2003 |
|
|
Chemical products |
-4.0 |
-2.6 |
|
Footwear and wearing apparel* |
-6.3 |
-14.3 |
|
Food manufacturing |
-1.3 |
-1.8 |
|
Transport equipment |
-2.6 |
6.1 |
|
Paper and paper products |
-6.3 |
-5.7 |
|
Wood and wood products |
-7.2 |
1.4 |
|
Basic metals |
-0.6 |
16.9 |
|
Rubber products |
-3.6 |
-0.7 |
|
Leather products* |
-17.2 |
-1.4 |
|
Furniture and fixtures |
-2.9 |
0.3 |
|
Nonmetallic mineral products |
-0.3 |
4.3 |
|
Publishing and printing* |
-0.9 |
31.9 |
Note: * - new sectors in the 1994-based series
Sectors are ranked according to their contribution to the overall 1994-based August 2003 growth rate.
Year-on-year growth rates are computed by dividing the current month value of net sales by previous year same month value of net sales less 1.
Month-on-month growth rates are computed by dividing the current month value of net sales by previous month value of net sales less 1.
1/ - Less than 0.1 percent decrease.
TABLE 2-B. VOLUME OF NET SALES, JULY - AUGUST 2003
(1994=100)
|
Gainers |
Year-on-Year Growth (percent) |
|
|
August 2003 |
July 2003 |
|
|
Electrical machinery |
56.9 |
-23.3 |
|
Basic metals |
40.4 |
25.1 |
|
Petroleum products |
15.4 |
6.0 |
|
Machinery, excluding electrical* |
62.7 |
68.5 |
|
Wood and wood products |
50.7 |
35.7 |
|
Nonmetallic mineral products |
15.1 |
23.0 |
|
Textile |
15.1 |
24.7 |
|
Publishing and printing* |
13.3 |
29.5 |
|
Miscellaneous manufactures |
5.7 |
3.6 |
|
|
||
|
Losers |
Year-on-Year Growth (percent) |
|
|
August 2003 |
July 2003 |
|
|
Tobacco |
-31.0 |
-38.5 |
|
Footwear and wearing apparel* |
-21.4 |
-0.3 |
|
Chemical products |
-7.5 |
-6.0 |
|
Transport equipment |
-9.0 |
-8.9 |
|
Paper and paper products |
-19.9 |
-18.8 |
|
Food manufacturing |
-1.7 |
10.3 |
|
Beverage |
-4.5 |
-8.3 |
|
Fabricated metal products* |
-12.6 |
-10.5 |
|
Rubber products |
-20.1 |
-0.8 |
|
Leather products* |
-49.5 |
-19.6 |
|
Furniture and fixtures |
-2.5 |
5.6 |
TABLE 2-B. VOLUME OF NET SALES, JULY - AUGUST 2003(concluded)
(1994=100)
|
Gainers |
Month-on-Month Growth (percent) |
|
|
August 2003 |
July 2003 |
|
|
Electrical machinery |
50.8 |
14.1 |
|
Tobacco |
9.3 |
-6.7 |
|
Machinery, excluding electrical* |
8.3 |
-2.4 |
|
Nonmetallic mineral products |
2.9 |
-0.2 |
|
Textile |
2.2 |
17.4 |
|
Petroleum products |
0.5 |
-2.1 |
|
Beverage |
0.3 |
-24.0 |
|
Fabricated metal products* |
0.3 |
-3.0 |
|
Miscellaneous manufactures |
0.1 |
5.5 |
|
|
||
|
Losers |
Month-on-Month Growth (percent) |
|
|
August 2003 |
July 2003 |
|
|
Chemical products |
-4.9 |
-1.8 |
|
Footwear and wearing apparel* |
-12.4 |
-12.2 |
|
Food manufacturing |
-1.4 |
-2.8 |
|
Transport equipment |
-2.6 |
5.6 |
|
Paper and paper products |
-6.3 |
-5.6 |
|
Basic metals |
-1.8 |
16.8 |
|
Wood and wood products |
-7.2 |
2.1 |
|
Furniture and fixtures |
-4.1 |
0.6 |
|
Rubber products |
-3.8 |
-0.4 |
|
Leather products* |
-17.2 |
-1.4 |
|
Publishing and printing* |
-0.9 |
31.9 |
Note: * - new sectors in the 1994-based series
Sectors are ranked according to their contribution to the overall 1994-based August 2003 growth rate.
Year-on-year growth rates are computed by dividing the current month volume of net sales by previous year same month volume of net sales less 1.
Month-on-month growth rates are computed by dividing the current month volume of net sales by previous month volume of net sales less 1.
Source: National Statistics Office
Manila, Philippines