- Manufacturing Output Still in Uptrend
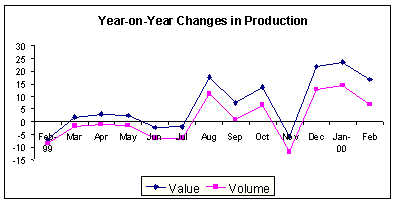
Production in manufacturing industry, as measured by the value of production index (VaPI) and volume of production index (VoPI), went up by 16.7 percent and 6.8 percent, respectively according to the preliminary results of the Monthly Integrated Survey of Selected Industries (MISSI).
Top gainers in terms of value of production and volume of production were petroleum refineries and electrical machinery, respectively.
- Net Sales Move in the Same Direction as Production
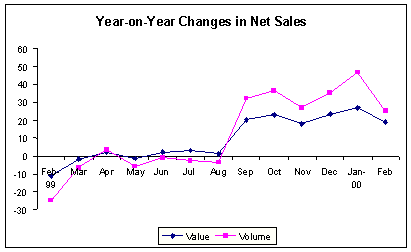
Net sales also moved in the same direction as production, with both value and volume posting 18.8 percent and 6.3 percent growths, respectively.
Petroleum products had the highest growth in value of net sales while paper & paper products posted the highest growth in volume of net sales.
- Average Capacity Utilization at 81.2%
Average capacity utilization for February 2000 for manufacturing was estimated at 81.2 percent, up by only 0.6 percentage point from 80.6 percent last year. Ten out of 16 sectors showed improvements in their capacity utilization as compared to the same month last year. Petroleum refineries registered the highest capacity utilization rate (95.0%) while transport equipment posted the lowest rate (66.5%).
- Producers Prices Climb
The producer price index for total manufacturing of 204.7 rose by 52.8 percent from 133.9 in February 1999. This could be attributed to the increases in the prices of electrical machinery (378.1%), glass (99.6%), furniture (94.4%), petroleum products (66.9%), transport (36.7%) and beverage (32.1%).
Value of Production
In February 2000, the VaPI of 525.6 increased by 16.7 percent from 450.2 in February 1999. Year-on-year increases were observed in 10 out of 16 major sectors (See Annex 1-A). Topping the gainers in terms of value were petroleum refineries which expanded by 50.4 percent. Other sectors that posted double-digit decreases were electrical machinery (35.6%), transport equipment (31.2%), wood and wood products (19.4%), tobacco (18.6%), rubber products (18.4%), other manufacturing industries (18.2%), and paper and paper products (13.5%).
Basic metals, which continuously recorded year-on-year declines since August 1998, had the biggest at 29.6 percent. Other sectors which exhibited year-on-year decreases were wearing apparel (-29.4%), chemicals/plastic and plastic products (-15.2%), food manufacturing (-11.9%), non-metallic mineral products (-4.0%) and textile (-1.7%).

Volume of Production
The February 2000 VoPI for total manufacturing increased by 6.8 percent to 139.8 from 130.9 last year. Ten out of 16 sectors posted year-on year increases led by electrical machinery which increased by 33.4 percent (See Annex 1-B). Other sectors which contributed to the positive performance were transport equipment (23.7%), petroleum refineries (4.6%), wood & wood products (19.4%), paper & paper products (11.2%), beverage (13.2%), rubber products (16.3%), other manufacturing industries (33.1%) and tobacco (18.7%). The improvements in these sectors can be attributed to the increased demand of these products for the local and export markets.
On the other hand, six sectors dipped in terms of volume of production led by basic metals which went down by 36.5 percent. Other sectors that had decreases were wearing apparel (-29.3%), chemicals/plastic & plastic products (-19.9%), non-metallic mineral products (-15.0%), textile (-12.2%) and food manufacturing (-9.3%). Decreases in these sectors can be attributed to the low demand for these products which are used in construction-related industries. In some cases, higher cost of raw materials and strikes resulted to the closure of a few plants and partial shutdown of machinery.
Value of Net Sales
The value of net sales for February 2000 increased by 18.8 percent compared to last year. Nine out of 16 sectors posted increases led by petroleum products which posted a year-on-year growth of 79.2 percent (See Annex 2-A). Other sectors that recorded double-digit increases were basic metals (20.6%), electrical machinery (33.1%), paper & paper products (60.8%), non-metallic mineral products (31.0%), beverage (18.9%), and furniture & fixtures (22.3%).
On the other hand, the most depressed net sales came from transport equipment, with sales value sliding 67.2 percent. Other sectors which declined in their value of net sales were textile (-18.2%), miscellaneous manufactures (-18.0%), rubber products (-12.0%), food manufacturing (-12.0%) and wearing apparel (-7.6%).

Volume of Net Sales
The volume of net sales for February 2000 increased by 6.3 percent over the same month last year. Increases were observed in 8 out of 16 sectors led by paper & paper products which increased by 57.6 percent (See Annex 2-B). Other sectors that exhibited double-digit year-on-year growths were petroleum products (24.7%), basic metals (16.0%), electrical machinery (30.9%), non-metallic mineral products (31.4%), beverage (30.3%), and furniture & fixtures (22.3%).
On the other hand, 8 sectors performed poorly in net sales led by transport equipment which declined by 69.1 percent. Together with the increased production, the dip in net sales indicate inventory management on the part of transport equipment manufactures. Other sectors that exhibited decreases were textile (-26.9%), rubber products (-13.5%), food manufacturing (-9.4%), miscellaneous manufactures (-7.6%), wearing apparel (-7.4%), and chemicals (-3.3%).
Capacity Utilization
The proportion of responding establishments operating below 70% capacity were 43.5 percent in February 2000 1999 compared to 41.8 percent a year ago. However, about 19.1 percent operated at full capacity (90%-100%) compared to 13.5 percent in February 1999.
The February 2000 average capacity utilization rate for manufacturing was estimated at 81.2 percent, which was slightly higher by 0.1 percentage point to 81.1 percent posted last year. Of the 16 major sectors, ten sectors posted higher capacity utilization rates as compared to a year ago. Petroleum refineries recorded the highest capacity utilization rate at 95.0 percent. Other sectors with more than 80 percent capacity utilization were tobacco (82.8%), paper & paper products (87.3%), rubber products (85.6%), non-metallic mineral products (83.0%) and electrical machinery (92.4%).
Response Rate
These results were based on the response of 349 sample establishments, which comprised 66.9 percent of the total number of establishments covered by the survey.


Percentage Changes in Production and Net Sales of
Key Enterprises: February 1999 - February 2000
|
|
|||||||||||||
| ITEM | 1999 | 2000 | |||||||||||
| FEB | MAR | APR | MAY | JUN | JUL | AUG | SEP | OCT | NOV | DEC | JAN | FEB | |
|
|
|||||||||||||
| Year-on-Year Change Production Value Volume Net Sales Value Volume |
-7.0r -11.1 |
2.0r -1.7 |
3.1r 2.1 |
2.4r -1.3 |
-2.2r 2.0 |
-2.0r 3.1 |
17.5r 1.4 |
7.5r 20.1 |
13.7r 22.9 |
-5.9r 18.2 |
21.7r 23.4 |
23.4r 26.8 |
16.7 18.8 |
| Month-on-Month Change Production Value Volume Net Sales Value Volume |
7.9r 31.3 |
11.0r 8.0 |
-11.0r -6.6 |
4.5r 7.0 |
4.8r 3.7 |
-3.2r 2.5 |
15.3r -2.8 |
-3.6r 12.6 |
0.5r 1.6 |
-19.2 -2.9 |
22.1r 3.9 |
-1.0r -3.5 |
2.2 -0.9 |
|
r - revised due to updating of data from late responding establishments. |
|||||||||||||
Source: National Statistics Office
Manila, Philippines
