
|
Total manufacturing |
February 2003 |
January 2003 |
|
Year-On-Year Growth |
|
|
|
Production Index |
|
|
|
Value(VaPI) |
11.4 |
12.8r |
|
Volume(VoPI) |
1.8 |
3.7r |
|
Net Sales Index |
|
|
|
Value |
17.5 |
19.7r |
|
Volume |
5.8 |
8.6r |
|
Producer's Price Index |
9.4 |
8.8r |
|
Average Capacity Utilization |
76.5 |
76.1r |
r -revised
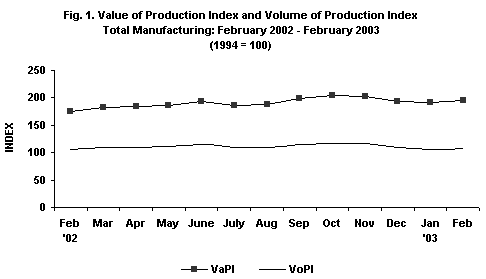
· Value of Production Index (VaPI) continues to improve
Value of Production Index (VaPI) of the manufacturing industry gained 11.4 percent in February 2003 over the year-ago figure, according to the preliminary results of the Monthly Integrated Survey of Selected Industries (MISSI). The robust production was boosted by basic metals which grew by 99.0 percent and by ten (10) other sectors which also posted double-digit increases:leather products, petroleum products, wood and wood products, textile, food manufacturing, furniture and fixtures, beverage, nonmetallic mineral products, footwear and wearing apparel and rubber products (see Table 1-A).
VaPI likewise registered an increase of 1.7 percent compared to the previous month. The top six (6) sectors contributing to this growth were the following: furniture and fixtures, textile, electrical machinery, footwear and wearing apparel, beverage and wood and wood products (see Table 1-A).
· Volume of Production Index (VoPI) posts lower growth
On a year-on-year basis, volume of Production Index (VoPI) climbed by 1.8 percent in February 2003, lower than the previous month's growth of 3.7 percent. The rise was brought about bybasic metals and wood and wood products which showed significant increases of 76.9 percent and 64.7 percent, respectively. Seven (7) other sectors also posted double-digit increases, namely: leather products, nonmetallic mineral products, textile, beverage, food manufacturing, furniture and fixtures and petroleum products (see Table 1-B).
On a monthly basis, VoPI recovered from its slump with a slight improvement of 1.4 percent in February 2003. Sectors that largely contributed to the lean growth were textile and furniture and fixtures (see Annex 1-B).

· Value of net sales continued its increasing trend with a year-on-year growth of 17.5 percent in February 2003. Significant increases were registered by fifteen (15) sectors led by petroleum products and textile, posting 47.4 percent and 38.7 percent, respectively. Other sectors that registered increases were footwear and wearing apparel, furniture and fixtures, publishing and printing, food manufacturing, rubber products, machinery excluding electrical, beverage, paper and paper products, wood and wood products, chemical products, electrical machinery, fabricated metal products and transport equipment (see Table 2-A).
On a month-on-month comparison, value of net sales recorded a slight increase of 0.1 percent in February 2003. The minimal growth could be attributed to the double�digit growth of the following sectors: rubber products, textile, footwear and wearing apparel and machinery excluding electrical (see Table 2-A).
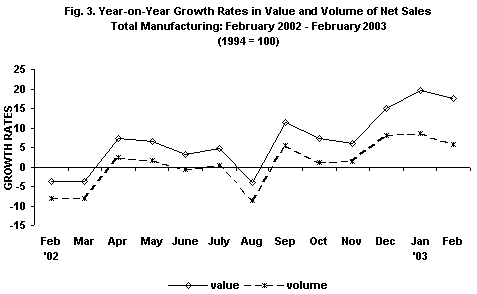
· Net Sales Volume gains anew
Net sales volume continues to outpace the year-ago figure with a growth of 5.8 percent in February 2003. Sectors largely contributing to the improved sales performance were the following:wood and wood products, textile, publishing and printing, machinery excluding electrical, furniture and fixtures, nonmetallic mineral products, petroleum products, food manufacturing, footwear and wearing apparel and beverage (see Table 2-B).
On a month-on-month basis, however, volume of net sales tumbled by 0.6 percent in February 2003. Double-digit decreases were observed in the following sectors: leather products, basic metals, petroleum products, miscellaneous manufactures, printing and publishing andtobacco (see Table 2-B).
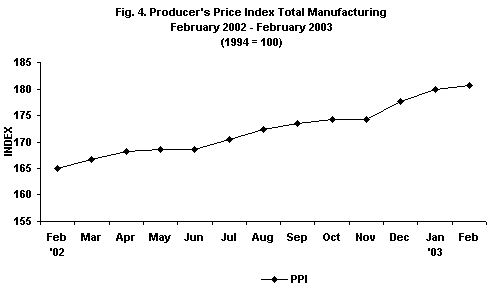
· Producer's Price Index (PPI) increases further
Producers Price Index (PPI) for total manufacturing on a year-on-year comparison registered an increase of 9.4 percent in February 2003. Petroleum products topped all sectors that exhibited double-digit increases with 28.6 percent. Other sectors with double-digit increments were the following: footwear and wearing apparel, paper and paper products, electrical machinery, chemical products, rubber products, basic metals and leather products. (see Table 5).
Similarly, PPI on a month-on-month basis for total manufacturing went up by a slim 0.3 percent in February 2003. Sectors that posted increased growth rates were footwear and wearing apparel, petroleum products, wood and wood products, beverage, basic metals, chemical products, rubber products and furniture and fixtures (see Table 5).
· Capacity Utilization
In February 2003, average capacity utilization for total manufacturing was estimated at 76.5 percent. Sectors that posted more than 80% capacity utilization rate were the following:machinery excluding electrical, footwear and wearing apparel and rubber products (see Table 6).
The proportion of responding establishments that operated at full capacity (90%-100%) in February 2003 was 22.5 percent. About 41.1 percent of the responding establishments operated at 70%-89% capacity and 36.5 percent of the establishments operated below 70% capacity.
DISTRIBUTION OF KEY MANUFACTURING ESTABLISHMENTS
BY CAPACITY UTILIZATION
TOTAL MANUFACTURING, FEBRUARY 2003
(In percent)
|
Capacity Utilization |
1994-based |
|
Below 50% |
12.5 |
|
50% - 59% |
10.4 |
|
60% - 69% |
13.6 |
|
70% - 79% |
17.7 |
|
80% - 89% |
23.4 |
|
90% - 100% |
22.5 |
Note: Details may not add up to 100 due to rounding.
· Response Rate
The response rate for February 2003 is 86.3 percent, which corresponds to the retrieval of 480 sample establishments reports (see Table 7).
RESPONSE RATES FOR TOTAL MANUFACTURING
(In percent)
|
February 2003 |
January 2003 |
|
86.3 |
92.1 |
· Technical Notes
Data of nonresponding sample establishments are estimated based on previous records and other available sources. Revisions to the preliminary estimates are done upon receipt of actual reports of late respondents.
|
|
(Sgd.) CARMELITA N. ERICTA |
TABLE 1-A. VALUE OF PRODUCTION INDEX, JANUARY - FEBRUARY 2003
(1994 =100)
|
Gainers |
Year-on-Year Growth (%) |
|
|
February 2003 |
January 2003 |
|
|
Basic metals |
99.0 |
127.0 |
|
Petroleum products |
43.9 |
30.0 |
|
Food manufacturing |
23.3 |
27.8 |
|
Beverage |
19.7 |
22.2 |
|
Textile |
26.0 |
32.4 |
|
Nonmtetallic mineral products |
16.2 |
7.4 |
|
Footwear and wearing apparel* |
13.0 |
36.8 |
|
Wood and wood products |
29.2 |
41.4 |
|
Furniture and fixtures |
22.7 |
30.7 |
|
Publishing and printing* |
9.5 |
7.5 |
|
Leather products* |
55.3 |
1.5 |
|
Rubber products |
10.5 |
-4.6 |
|
Paper and paper products |
2.5 |
-9.5 |
|
machinery, excluding electrical* |
3.2 |
0.1 |
|
Fabricated metal products* |
0.5 |
11.4 |
|
|
||
|
Losers |
Year-on-Year Growth (%) |
|
|
February 2003 |
January 2003 |
|
|
Tobacco |
-39.9 |
-49.6 |
|
Chemical products |
-9.1 |
-6.1 |
|
Electrical machinery |
-2.9 |
2.1 |
|
Transport equipment |
-5.4 |
6.1 |
|
Miscellaneous manufactures |
-5.3 |
8.5 |
TABLE 1-A. VALUE OF PRODUCTION INDEX, JANUARY - FEBRUARY 2003 (concluded)
(1994=100)
|
Gainers |
Month-on-Month Growth (%) |
|
|
February 2003 |
January 2003 |
|
|
Electrical machinery |
7.8 |
-13.4 |
|
Food manufacturing |
3.9 |
-2.7 |
|
Beverage |
7.6 |
-15.1 |
|
Footwear and wearing apparel* |
7.7 |
-23.4 |
|
Textile |
8.5 |
4.4 |
|
Nonmetallic mineral products |
3.7 |
4.3 |
|
Furniture and fixtures |
10.9 |
14.7 |
|
Wood and wood products |
6.2 |
28.9 |
|
Tobacco |
1.7 |
1.8 |
|
Paper and paper products |
1.8 |
2.6 |
|
machinery, excluding electrical* |
1.7 |
-20.4 |
|
Rubber products |
2.2 |
19.4 |
|
|
||
|
Losers |
Month-on-Month Growth (%) |
|
|
February 2003 |
January 2003 |
|
|
Transport equipment |
-5.9 |
5.0 |
|
Chemical products |
-1.8 |
-2.7 |
|
Petroleum products |
-1.5 |
9.7 |
|
Publishing and printing* |
-10.1 |
18.4 |
|
Fabricated metal products* |
-5.7 |
-9.0 |
|
Leather products* |
-38.6 |
106.0 |
|
Miscellaneous manufactures |
3.9 |
10.1 |
|
Basic metals |
-0.3 |
103.7 |
Note: * - new sectors in the 1994-based series
Sectors are ranked according to their contribution to the overall 1994-based January 2003 growth rate.
Year-on-year growth rates are computed by dividing the current month index by previous year same month index less 1.
Month-on-month growth rates are computed by dividing the current month index by previous month index less 1.
TABLE 1-B. VOLUME OF PRODUCTION INDEX, JANUARY - FEBRUARY 2003
|
Gainers |
Year-on-Year Growth (%) |
|
|
February 2003 |
January 2003 |
|
|
Basic metals |
76.9 |
101.4 |
|
Food manufacturing |
12.8 |
17.7 |
|
Petroleum products |
11.9 |
5.9 |
|
Nonmetallic mineral products |
38.0 |
26.5 |
|
Beverage |
16.7 |
20.4 |
|
Textile |
29.0 |
28.4 |
|
Wood and wood products |
64.7 |
83.8 |
|
Publishing and printing* |
9.5 |
7.5 |
|
Furniture and fixtures |
12.4 |
18.1 |
|
Leather products* |
38.1 |
-9.7 |
|
machinery, excluding electrical* |
3.2 |
0.1 |
|
Fabricated metal products* |
1.6 |
12.6 |
|
|
||
|
Losers |
Year-on-Year Growth (%) |
|
|
February 2003 |
January 2003 |
|
|
Chemical products |
-21.5 |
-19.5 |
|
Tobacco |
-39.9 |
-50.6 |
|
Transport equipment |
-7.1 |
3.4 |
|
Footwear and wearing apparel* |
-6.4 |
14.6 |
|
Paper and paper products |
-13.6 |
-24.2 |
|
Electrical machinery |
-16.4 |
-10.6 |
|
Miscellaneous manufactures |
-7.0 |
6.8 |
|
Rubber products |
-2.2 |
-15.4 |
TABLE 1-B. VOLUME OF PRODUCTION INDEX, JANUARY - FEBRUARY 2003
(concluded)
(1994=100)
|
Gainers |
Year-on-Year Growth (%) |
|
|
February 2003 |
January 2003 |
|
|
Food manufacturing |
3.9 |
2.6 |
|
Textile |
13.9 |
2.1 |
|
Beverage |
5.4 |
-15.1 |
|
Nonmetallic mineral products |
3.9 |
0.5 |
|
Footwear and wearing apparel* |
2.5 |
-32.5 |
|
Electrical machinery |
8.1 |
-19.2 |
|
Furniture and fixtures |
10.8 |
13.6 |
|
Paper and paper products |
2.7 |
-13.8 |
|
Tobacco |
1.7 |
-30.2 |
|
Wood and wood products |
3.8 |
27.8 |
|
Machinery, excluding electrical* |
1.7 |
-21.0 |
|
Rubber products |
2.1 |
19.4 |
|
|
||
|
Losers |
Month-on-Month Growth (%) |
|
|
February 2003 |
January 2003 |
|
|
Petroleum products |
-6.1 |
6.4 |
|
Transport equipment |
-5.5 |
4.6 |
|
Chemical products |
-2.1 |
-6.0 |
|
Publishing and printing* |
-10.1 |
18.4 |
|
Fabricated metal products* |
-5.7 |
-7.7 |
|
Leather products* |
-38.6 |
75.3 |
|
Miscellaneous manufactures |
-3.9 |
8.2 |
|
Basic metals |
-0.6 |
96.1 |
Note: * - new sectors in the 1994-based series
Sectors are ranked according to their contribution to the overall 1994-based January 2003 growth rate.
Year-on-year growth rates are computed by dividing the current month index by previous year same month index less 1.
Month-on-month growth rates are computed by dividing the current month index by previous month index less 1.
TABLE 2-A. VALUE OF NET SALES, JANUARY - FEBRUARY 2003
(1994=100)
|
Gainers |
Year-on-Year Growth (%) |
|
|
February 2003 |
January 2003 |
|
|
Petroleum products |
47.4 |
54.3 |
|
Food manufacturing |
24.3 |
29.1 |
|
Footwear and wearing Apparel* |
35.5 |
21.8 |
|
Chemical products |
10.8 |
19.2 |
|
Textile |
38.7 |
20.9 |
|
Electrical machinery |
9.5 |
3.7 |
|
Beverage |
14.7 |
6.5 |
|
Publishing and printing* |
30.4 |
27.0 |
|
Machinery, excluding electrical* |
21.9 |
12.1 |
|
Paper and paper products |
12.7 |
6.9 |
|
Transport equipment |
3.9 |
-0.6 |
|
Furniture and fixtures |
31.1 |
34.8 |
|
Wood and wood products |
20.7 |
7.9 |
|
Rubber products |
22.1 |
-12.0 |
|
Wood and wood products |
11.8 |
20.8 |
|
Fabricated metal products* |
5.4 |
4.0 |
|
|
||
|
Losers |
Year-on-Year Growth (%) |
|
|
February 2003 |
January 2003 |
|
|
Tobacco |
-33.8 |
-28.2 |
|
Basic metals |
-7.9 |
19.0 |
|
Nonmetallic mineral products |
-1.7 |
4.2 |
|
Leather products* |
-13.3 |
-33.6 |
|
Miscellaneous manufactures |
-1.0 |
28.3 |
TABLE 2-A. VALUE OF NET SALES, JANUARY - FEBRUARY 2003 (concluded)
(1994=100)
|
Gainers |
Month-on-Month Growth (%) |
|
|
February 2003 |
January 2003 |
|
|
Food manufacturing |
3.4 |
-18.2 |
|
Beverage |
9.6 |
-28.8 |
|
Textile |
17.2 |
-8.4 |
|
Footwear and wearing Apparel* |
11.8 |
-27.0 |
|
Transport equipment |
7.8 |
-6.9 |
|
Electrical machinery |
2.6 |
-12.7 |
|
Rubber products |
40.3 |
-6.9 |
|
Machinery, excluding electrical |
11.6 |
-15.0 |
|
Wood and wood products |
9.7 |
-7.7 |
|
Furniture and fixtures |
6.1 |
8.7 |
|
Fabricated metal products* |
2.0 |
-20.6 |
|
|
||
|
Losers |
Month-on-Month Growth (%) |
|
|
February 2003 |
January 2003 |
|
|
Petroleum products |
-11.5 |
21.0 |
|
Basic metals |
-20.4 |
-10.0 |
|
Tobacco |
-10.0 |
-19.0 |
|
Chemical products |
-1.5 |
-4.1 |
|
Publishing and printing* |
-10.4 |
6.8 |
|
Miscellaneous manufactures |
-10.7 |
22.1 |
|
Leather products* |
-22.1 |
72.0 |
|
Paper and paper products |
-0.2 |
7.5 |
|
Nonmetallic mineral products |
0.0 |
16.7 |
Note: * - new sectors in the 1994-based series
Sectors are ranked according to their contribution to the overall 1994-based January 2003 growth rate.
Year-on-year growth rates are computed by dividing the current month value of net sales by previous year same month value of net sales less 1.
Month-on-month growth rates are computed by dividing the current month value of net sales by previous month value of net sales less 1
TABLE 2-B. VOLUME OF NET SALES, JANUARY - FEBRUARY 2003
(1994=100)
|
Gainers |
Year-on-Year Growth (%) |
|
|
February 2003 |
January 2003 |
|
|
Food manufacturing |
13.7 |
18.8 |
|
Petroleum products |
14.6 |
25.7 |
|
Textile |
42.0 |
17.3 |
|
Beverage |
11.8 |
4.9 |
|
Nonmetallic mineral products |
16.8 |
22.7 |
|
Footwear and wearing Apparel* |
12.3 |
2.0 |
|
Wood and wood products |
42.5 |
56.9 |
|
Publishing and printing* |
30.4 |
27.0 |
|
Machinery, excluding electrical* |
21.9 |
12.1 |
|
Furniture and fixtures |
20.1 |
21.9 |
|
Fabricated metal products* |
6.6 |
5.2 |
|
Transport equipment |
2.0 |
-3.1 |
|
Rubber products |
8.1 |
-21.9 |
|
|
||
|
Losers |
Year-on-Year Growth (%) |
|
|
February 2003 |
January 2003 |
|
|
Basic metals |
-18.1 |
5.5 |
|
Tobacco |
-33.8 |
-29.7 |
|
Electrical machinery |
-5.8 |
-9.3 |
|
Chemical products |
-4.3 |
2.3 |
|
Paper and paper products |
-4.9 |
-10.5 |
|
Leather products* |
-22.9 |
-41.0 |
|
Miscellaneous manufactures |
-2.8 |
26.4 |
TABLE 2-B. VOLUME OF NET SALES, JANUARY - FEBRUARY 2003(concluded)
(1994=100)
|
Gainers |
Month-on-Month Growth (%) |
|
|
February 2003 |
January 2003 |
|
|
Textile |
23.1 |
-10.4 |
|
Food manufacturing |
3.4 |
-13.8 |
|
Transport equipment |
8.2 |
-7.3 |
|
Beverage |
7.4 |
-28.9 |
|
Footwear and wearing apparel* |
6.4 |
-35.7 |
|
Rubber products |
40.1 |
-6.9 |
|
Machinery, excluding electrical* |
11.6 |
-15.7 |
|
Wood and wood products |
7.2 |
-8.5 |
|
Furniture and fixtures |
6.1 |
7.6 |
|
Fabricated metal products* |
2.0 |
-19.5 |
|
Electrical machinery |
2.9 |
-18.6 |
|
Paper and paper products |
0.7 |
-9.7 |
|
Nonmetallic mineral products |
0.2 |
12.4 |
|
|
||
|
Losers |
Month-on-Month Growth (%) |
|
|
February 2003 |
January 2003 |
|
|
Petroleum products |
-15.7 |
17.4 |
|
Basic metals |
-20.7 |
-13.4 |
|
Tobacco |
-10.0 |
-19.1 |
|
Chemical products |
-1.7 |
-7.3 |
|
Publishing and printing* |
-10.4 |
6.8 |
|
Miscellaneous manufactures |
-10.7 |
19.9 |
|
Leather products* |
-22.1 |
46.3 |
Note: * - new sectors in the 1994-based series
Sectors are ranked according to their contribution to the overall 1994-based January 2003 growth rate.
Year-on-year growth rates are computed by dividing the current month volume of net sales by previous year same month volume of net sales less 1.
Month-on-month growth rates are computed by dividing the current month volume of net sales by previous month volume of net sales less 1.
Source: National Statistics Office
Manila, Philippines