
|
Table A Year-on-Year Growth Rates for Production Index, Net Sales Index
and Producer Price Index: Febuary 2015 and February 2014
|
||
|---|---|---|
|
TOTAL MANUFACTURING |
February
2015
|
February
2014
|
|
YEAR-ON-YEAR GROWTH |
|
|
|
Production Index (2000=100) |
|
|
|
Value (VaPI) |
-2.0 |
5.1 |
|
Volume (VoPI) |
4.4 |
6.0 |
|
Net Sales Index (2000=100) |
|
|
|
Value (VaNSI) |
-0.5 |
9.6 |
|
Volume (VoNSI) |
6.1 |
10.5 |
|
Producer Price Index (2000=100) |
-6.2r |
-0.8 |
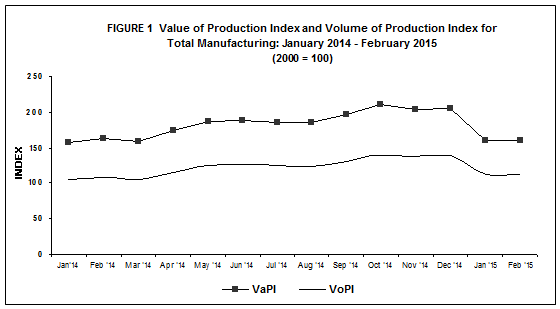
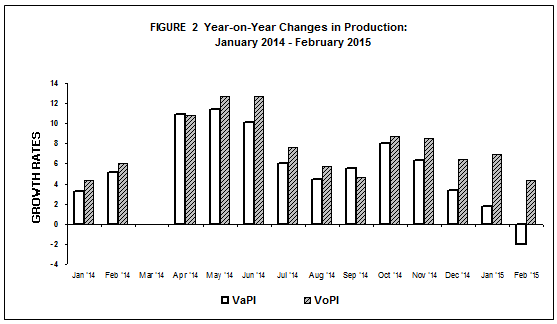
- Value of Production Index contracts in February 2015
Value of Production Index (VaPI) decelerated as it posted an annual decrease of 2.0 percent in February 2015, according to the preliminary results of the Monthly Integrated Survey of Selected Industries (MISSI). Ten major sectors showed significant decreases in VaPI as follows: furniture and fixtures (-51.9%), petroleum products (-30.8%), footwear and wearing apparel (-19.6%), rubber and plastic products (-16.3%), and chemical products (-15.9%). Refer to Tables 1-A and 1.
- Volume of Production maintains its positive rate in February 2015
Volume of Production Index (VoPI), however, grew at a slower rate of 4.4 percent in February 2015 compared with 6.0 percent growth during the same period of last year. The increment was mainly due to the improved performance in production output observed in 12 major sectors, with two-digit increases reported by the following: leather products (86.8%), tobacco products (55.2%), printing (51.4%), basic metals (38.8%), beverages (38.6%), textiles (20.3%), non-metallic mineral products (17.5%), wood and wood products (16.2%), and paper and paper products (15.1%). Refer to Tables 1-B and 2.
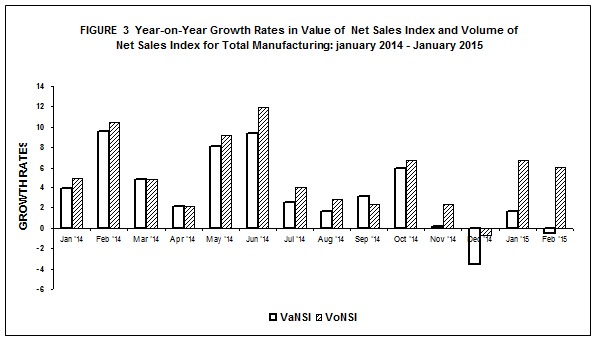
- Value of Net Sales Index posts a negative rate
Value of Net Sales Index (VaNSI) shrank by negative 0.5 percent in February 2015 compared with 9.6 percent growth registered in February 2014. Five major sectors that largely contributed to the reduction in VaNSI were: petroleum products (-25.7%), printing (-26.0%), footwear and wearing apparel (-23.2%), miscellaneous manufactures (-11.2%), and wood and wood products (-10.3%). Refer to Tables 2-A and 3.
- Volume of Net Sales Index gains in February 2015
Volume of Net Sales Index (VoNSI) attained a slower growth of 6.1 percent in February 2015 compared with 10.5 percent growth during the same month of last year. The increase was brought about by the expansion in sales output of 15 major sectors, with significant increases noted in the following: furniture and fixtures (39.9%), basic metals (35.0%), transport equipment (26.8%), chemical products (21.2%), fabricated metal products (21.2%), textiles (17.1%), leather products (16.0%), and non-metallic mineral products (13.4%). Refer to Tables 2-B and 4.
- Capacity Utilization in February 2015 is 83.3 percent
Average capacity utilization in February 2015 for total manufacturing was recorded at 83.3 percent. About 60 percent or twelve of the 20 major industries operated at 80 percent and above capacity utilization rates. These are:
-
basic metals (88.6%)
-
petroleum products (88.3%)
-
non-metallic mineral products (86.3%)
-
machinery except electrical (84.5%)
-
food manufacturing (84.5%)
-
electrical machinery (84.4%)
-
paper and paper products (82.7%)
-
rubber and plastic products (82.4%)
-
chemical products (82.1%)
-
printing (81.8%)
-
wood and wood products (81.6%)
-
textiles (80.9%)
The proportion of establishments that operated at full capacity (90% to 100%) was 23.6 percent in February 2015. About 58.1 percent of the establishments operated at 70% to 89% capacity while 18.3 percent of the establishments operated below 70% capacity. Refer to Table 6 and B.
|
Table B Distribution of Key Manufacturing Establishments by Capacity Utilization for Total Manufacturing: February 2015 |
|
|---|---|
|
Capacity Utilization |
Percent Share |
|
Below 50% |
4.5 |
|
50% - 59% |
3.7 |
|
60% - 69% |
10.1 |
|
70% - 79% |
22.5 |
|
80% - 89% |
35.6 |
|
90% - 100% |
23.6 |
- Industry Coverage
The 2015 MISSI utilizes the 2009 Philippine Standard Industrial Classification (PSIC) to classify major industries and sub-industries. Twenty major industries of the 2009 PSIC were formed to comprise the industry coverage of the 2015 MISSI. These are presented in the table below.
|
2009 PSIC CODE |
INDUSTRY DESCRIPTION |
|---|---|
|
C10 |
Food manufacturing * |
|
C11 |
Beverages |
|
C12 |
Tobacco products |
|
C13 |
Textiles* |
|
C14, C152 |
Footwear and wearing apparel |
|
C151 |
Leather products |
|
C16 |
Wood and wood products* |
|
C17 |
Paper and paper products |
|
C18 |
Printing |
|
C19 |
Petroleum products* |
|
C20,C21 |
Chemical products* |
|
C22 |
Rubber and plastic products* |
|
C23 |
Non-metallic mineral products* |
|
C24 |
Basic metals* |
|
C25,C3311 |
Fabricated metal products |
|
C262,C275,C28, C263,C268,C3312,C332 |
Machinery except electrical* |
|
C261,C264,C27, C29301,C3314,C332 |
Electrical machinery* |
|
C29 except C29301, C30,C3315 |
Transport equipment |
|
C31 |
Furniture and fixtures |
|
C265,C266,C267,C32, C3313,C3319 |
Miscellaneous manufactures |
|
Note: * - Major industries categorized into sub-industries |
|
- Response Rate
The response rates for the February 2015 MISSI and PPS are 77.1 percent and 89.7 percent, respectively. Refer to Tables 7 and 8.
|
Table C Response Rates For Total Manufacturing
(In percent)
|
||
|---|---|---|
|
|
February 2015 |
January 2015
(Revised)
|
|
MISSI |
77.1 |
87.8r |
|
PPS |
89.7 |
92.9r |
Data of non-responding samples were estimated using short term relative of responding samples within the industry class. Revisions to the preliminary estimates are done upon receipt of actual reports of late respondents.
(Sgd) LISA GRACE S. BERSALES, Ph.D.
National Statistician
TABLE 1-A Value of Production Index, January 2015– February 2015
(2000 =100)
|
Gainers |
Year-on-Year Growth (%) |
|
|---|---|---|
| February 2015 |
January 2015
(revised)
|
|
|
Beverages |
46.7 |
46.5 |
|
Basic metals |
30.0 |
44.8 |
|
Tobacco products |
66.3 |
44.4 |
|
Printing |
51.4 |
192.8 |
|
Textiles |
20.9 |
22.5 |
|
Non-metallic mineral products |
11.7 |
16.7 |
|
Paper and paper products |
15.8 |
24.4 |
|
Leather products |
86.6 |
81.6 |
|
Machinery except electrical |
1.6 |
9.0 |
|
Wood and wood products |
4.5 |
-16.1 |
|
Losers |
Year-on-Year Growth (%) |
|
|---|---|---|
| February 2015 |
January 2015
(revised)
|
|
|
Petroleum products |
-30.8 |
-35.4 |
|
Chemical products |
-15.9 |
2.5 |
|
Electrical machinery |
-4.5 |
5.5 |
|
Footwear and wearing apparel |
-19.6 |
-26.5 |
|
Rubber and plastic products |
-16.3 |
2.7 |
|
Furniture and fixtures |
-51.9 |
-9.7 |
|
Food manufacturing |
-2.1 |
-8.8 |
|
Transport equipment |
-4.5 |
19.7 |
|
Miscellaneous manufactures |
-6.5 |
-10.8 |
|
Fabricated metal products |
-6.6 |
-9.0 |
Notes:
TABLE 1-B Volume of Production Index, January 2015– February 2015
(2000 = 100)
|
Gainers |
Year-on-Year Growth (%) |
|
|---|---|---|
| February 2015 |
January 2015
(revised)
|
|
|
Beverages |
38.6 |
38.5 |
|
Basic metals |
38.8 |
49.5 |
|
Tobacco products |
55.2 |
30.6 |
|
Electrical machinery |
5.7 |
11.8 |
|
Printing |
51.4 |
192.8 |
|
Non-metallic mineral products |
17.5 |
23.0 |
|
Textiles |
20.3 |
21.8 |
|
Chemical products |
4.7 |
26.6 |
|
Paper and paper products |
15.1 |
21.1 |
|
Leather products |
86.8 |
81.9 |
|
Machinery except electrical |
2.0 |
10.1 |
|
Wood and wood products |
16.2 |
-16.6 |
|
Losers |
Year-on-Year Growth (%) |
|
|---|---|---|
| February 2015 |
January 2015
(revised)
|
|
|
Food manufacturing |
-4.0 |
-11.5 |
|
Rubber and plastic products |
-21.7 |
-3.8 |
|
Petroleum products |
-5.4 |
-4.2 |
|
Footwear and wearing apparel |
-18.3 |
-23.0 |
|
Furniture and fixtures |
-30.3 |
15.7 |
|
Transport equipment |
-3.3 |
19.0 |
|
Miscellaneous manufactures |
-6.5 |
-3.1 |
|
Fabricated metal products |
-3.9 |
-5.1 |
Notes:
TABLE 2-A Value of Net Sales Index, January 2015– February 2015
(2000 =100)
|
Gainers |
Year-on-Year Growth (%) |
|
|---|---|---|
| February 2015 |
January 2015
(revised)
|
|
|
Basic metals |
26.5 |
59.2 |
|
Transport equipment |
25.2 |
27.7 |
|
Food manufacturing |
6.2 |
1.7 |
|
Beverages |
13.7 |
-6.5 |
|
Textiles |
17.8 |
-2.6 |
|
Fabricated metal products |
17.7 |
-18.5 |
|
Non-metallic mineral products |
7.8 |
-3.8 |
|
Rubber and plastic products |
7.7 |
7.7 |
|
Paper and paper products |
4.1 |
0.5 |
|
Machinery except electrical |
0.6 |
11.9 |
|
Leather products |
15.9 |
19.8 |
|
Losers |
Year-on-Year Growth (%) |
|
|---|---|---|
| February 2015 |
January 2015
(revised)
|
|
|
Petroleum products |
-25.7 |
-29.9 |
|
Electrical machinery |
-5.9 |
-2.8 |
|
Footwear and wearing apparel |
-23.2 |
-30.9 |
|
Printing |
-26.0 |
16.6 |
|
Chemical products |
-2.6 |
40.1 |
|
Miscellaneous manufactures |
-11.2 |
-13.3 |
|
Tobacco products |
-9.6 |
6.7 |
|
Wood and wood products |
-10.3 |
-36.4 |
|
Furniture and fixtures |
-3.3 |
-3.1 |
Notes:
TABLE 2-B Volume of Net Sales Index, January 2015– February 2015
(2000 = 100)
|
Gainers |
Year-on-Year Growth (%) |
||
|---|---|---|---|
| February 2015 |
January 2015
(revised)
|
||
|
Chemical products |
21.2 |
73.1 |
|
|
Basic metals |
35.0 |
64.2 |
|
|
Transport equipment |
26.8 |
27.0 |
|
|
Electrical machinery |
4.2 |
2.9 |
|
|
Food manufacturing |
4.2 |
-1.2 |
|
|
Non-metallic mineral products |
13.4 |
1.4 |
|
|
Beverages |
7.5 |
-11.6 |
|
|
Textiles |
17.1 |
-3.2 |
|
|
Fabricated metal products |
21.2 |
-15.0 |
|
|
Furniture and fixtures |
39.9 |
24.2 |
|
|
Petroleum products |
1.5 |
4.0 |
|
|
Machinery except electrical |
1.0 |
13.0 |
|
|
Paper and paper products |
3.4 |
-2.2 |
|
|
Leather products |
16.0 |
19.9 |
|
|
Rubber and plastic products |
0.8 |
1.2 |
|
|
Losers |
Year-on-Year Growth (%) |
|
|---|---|---|
| February 2015 |
January 2015
(revised)
|
|
|
Footwear and wearing apparel |
-22.0 |
-27.6 |
|
Tobacco products |
-15.6 |
-3.5 |
|
Printing |
-26.0 |
16.6 |
|
Miscellaneous manufactures |
-11.2 |
-5.9 |
|
Wood and wood products |
-0.2 |
-36.8 |
Notes: