
|
Table A Year-on-Year Growth Rates for Production Index, Net Sales Index and Producer Price Index: January 2013 and December 2012 |
||
|---|---|---|
|
TOTAL MANUFACTURING |
JANUARY
2013
|
DECEMBER
2012
|
|
YEAR-ON-YEAR GROWTH |
|
|
|
Production Index (2000=100) |
|
|
|
Value (VaPI) |
8.5 |
5.3r |
|
Volume (VoPI) |
18.6 |
9.2r |
|
Net Sales Index (2000=100) |
|
|
|
Value (VaNSI) |
9.5 |
8.1r |
|
Volume (VoNSI) |
19.7 |
12.1r |
|
Producer Price Index (2000=100) |
-8.5r |
-3.6r |
r - revised
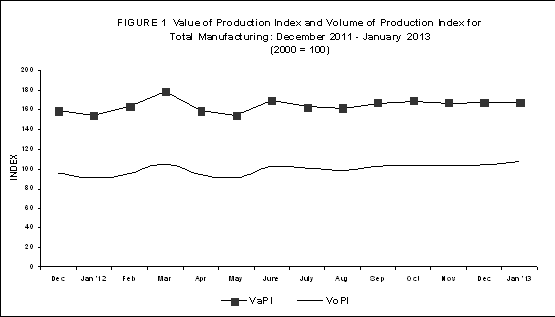
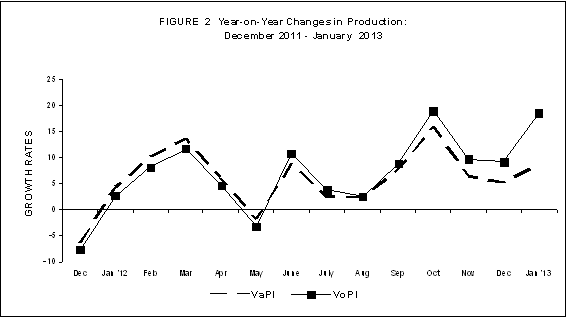
- Value of Production rises in January 2013
Value of Production Index (VaPI) of the manufacturing industry went up to 8.5 percent in January 2013, according to the preliminary results of the Monthly Integrated Survey of Selected Industries (MISSI). The sectors with two-digit increase that significantly contributed to the improvement of VaPI were as follows: footwear and wearing apparel, chemical products, food manufacturing, non-metallic mineral products, beverages, and fabricated metal products. Refer to Tables 1-A and 1.
On the other hand, VaPI, on a month-on-month comparison, slightly increased by 0.02 percent in January 2013 brought about mainly by the significant increment posted by transport equipment (25.9%). Two major sectors that posted significant decrease in production were tobacco products (-59.2) and footwear and wearing apparel (-37.6). Refer to Tables 1-A and 1.
- Volume of Production accelerates in January 2013
On a yearly comparison, Volume of Production Index (VoPI) continued to grow posting an increment of 18.6 percent in January 2013. Nine major sectors recorded double-digit positive growths led by chemical products (40.3%). The other sectors that exhibited significant increases were: food manufacturing (37.3%), footwear and wearing apparel (28.3%), machinery except electrical (22.2%), basic metals (21.3%), non-metallic mineral products (13.7%), fabricated metals (12.8%), rubber and plastic products (12.5%) and transport equipment (10.8%). Refer to Tables 1-B and 2.
On a monthly comparison, production volume grew moderately by 2.7 percent in January 2013. This was mainly due to the significant increase in production output observed in 2 major sectors namely: transport equipment (30.2%) and rubber and plastic products (19.0%). Moreover, nine out of the 20 major sectors of the manufacturing industry reflected single-digit increase. Refer to Tables 1-B and 2.
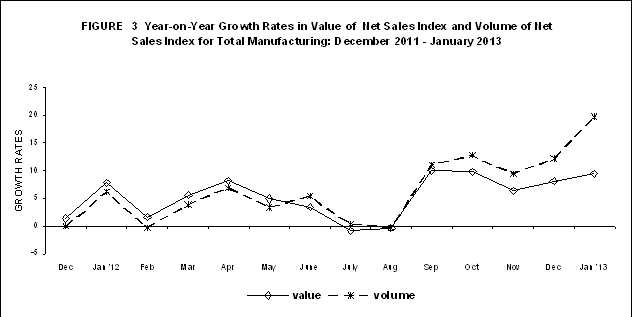
- Value of Net Sales moves up in January 2013
Value of Net Sales Index (VaNSI) continued to increase, showing an upward growth of 9.5 percent in January 2013. Significant expansion was noted in footwear and wearing apparel, which slowly grew by 41.1% from 210.6 percent in December 2012. Non-metallic mineral products also showed good performance as it posted an increase of 35.4 percent due to the strong domestic demand for glass and glass products. Other major manufacturing sectors that posted double-digit increase were: beverages (28.5%), tobacco (18.4%), food manufacturing (17.3%), transport equipment (14.5%) and chemical products (13.3%). Refer to Tables 2-A and 3.
On a monthly comparison, VaNSI dropped by 2.8 percent in January 2013. This was due to the double-digit decrease reflected by footwear and wearing appare (-38.0%) and publishing and printing (-15.2%). Refer to Tables 2-A and 3.
- Volume of Net Sales keeps positive annual rate
Volume of Net Sales Index (VoNSI) expanded, exhibiting a 19.7 percent increase in January 2013. Twelve major sectors posted double-digit increments led by machinery except electrical which accelerated to 45.5 percent from 19.1 percent in December 2012. Other sectors that contributed significantly to the good performance of VoNSI were the following: electrical machinery (38.6%), non-metallic mineral products (35.9%), footwear and wearing apparel (31.3%), food manufacturing (31.2%), tobacco products (27.5%), transport equipment (20.4%), beverages (20.1%), chemical products (19.5%), rubber and plastic products (12.9%), basic metals (12.6%) and furniture and fixtures (11.2%). Refer to Tables 2-B and 4.
On a month-on-month comparison, VoNSI made a turnaround as it dropped to -0.2 percent in January 2013 from a 2.7 percent posted in December 2012. This was due to the double-digit decrease posted by footwear and wearing apparel (-40.7%) and publishing and printing (-26.9%). Refer to Tables 2-B and 4.
- Capacity Utilization in January 2013 is 83.3
Average capacity utilization in January 2013 for total manufacturing stood at 83.3 percent. More than half or fifty-five percent of the 20 major sectors registered capacity utilization rates of 80 percent or more. These were:
- petroleum products (87.9%)
- basic metals (87.8%)
- food manufacturing (87.6%)
- machinery except electrical (84.7%)
- electrical machinery (84.5%)
- non-metallic mineral products (84.4%)
- rubber and plastic products (82.9%)
- chemical products (82.6%)
- miscellaneous manufactures (81.5%)
- paper and paper products (81.3%)
- wood and wood products (80.7%)
The proportion of establishments that operated at full capacity (90% to 100%) was 19.3 percent in January 2013. About 57.5 percent of the establishments operated at 70% to 89% capacity while 23.2 percent of the establishments operated below 70% capacity. Refer to Table 6.
|
Table B Distribution of Key Manufacturing Establishments by Capacity Utilization for Total Manufacturing: January 2013 |
|
|---|---|
|
Capacity Utilization |
Percent Share |
|
Below 50% |
4.6 |
|
50% - 59% |
6.5 |
|
60% - 69% |
12.1 |
|
70% - 79% |
18.2 |
|
80% - 89% |
39.3 |
|
90% - 100% |
19.3 |
- Industry Coverage
The industry coverage of the 2013 MISSI conforms with the amended 1994 PSIC groupings. There are 20 major sectors, as shown below, with 10 further disaggregated into sub-sectors.
|
PSIC CODE |
INDUSTRY DESCRIPTION |
|---|---|
|
15 except 155 |
Food manufacturing * |
|
155 |
Beverages |
|
16 |
Tobacco products |
|
17 |
Textiles* |
|
18,174 and 192 |
Footwear and wearing apparel |
|
191 |
Leather products |
|
20 |
Wood and wood products* |
|
21 |
Paper and paper products |
|
22 |
Publishing and printing |
|
23 |
Petroleum products* |
|
24 |
Chemical products* |
|
25 |
Rubber and plastic products* |
|
26 |
Non-metallic mineral products* |
|
27 |
Basic metals* |
|
28 |
Fabricated metal products |
|
29 and 30 |
Machinery except electrical* |
|
31 and 32 |
Electrical machinery* |
|
34 and 35 |
Transport equipment |
|
36 |
Furniture and fixtures |
|
33,37 and 39 |
Miscellaneous manufactures |
|
Note: * - Major sectors categorized into sub-sectors |
|
- Response Rate
The response rates for the January 2013 MISSI and PPS are 46.4 percent and 77.0 percent, respectively. Refer to Tables 7 and 8.
|
Table C Response Rates For Total Manufacturing
(In percent)
|
||
|---|---|---|
|
|
January 2013 |
December 2012
(Revised)
|
|
MISSI |
46.4 |
88.7r |
|
PPS |
77.0r |
91.8r |
r -revised
Data of non-responding sample establishments are estimated based on previous records and other available sources. Revisions to the preliminary estimates are done upon receipt of actual reports of late respondents.
(Sgd) CARMELITA N. ERICTA
Administrator
TABLE 1-A Value of Production Index, December 2012– January 2013
(2000 =100)
|
Gainers |
Year-on-Year Growth (%) |
|
|---|---|---|
| January 2013 |
December 2012
(revised)
|
|
|
Food manufacturing |
22.7 |
20.5 |
|
Chemical products |
33.0 |
-3.1 |
|
Footwear and wearing apparel |
37.8 |
141.1 |
|
Machinery except electrical |
7.5 |
-0.5 |
|
Beverages |
10.9 |
-2.9 |
|
Basic metals |
9.0 |
6.6 |
|
Non-metallic mineral products |
13.3 |
4.8 |
|
Transport equipment |
5.3 |
-25.1 |
|
Fabricated metal products |
10.5 |
1.6 |
|
Leather products |
6.1 |
19.2 |
|
Rubber and plastic products |
0.5 |
-6.5 |
|
Losers |
Year-on-Year Growth (%) |
|
|---|---|---|
| January 2013 |
December 2012
(revised)
|
|
|
Electrical machinery |
-8.9 |
-14.1 |
|
Petroleum products |
-9.2 |
5.5 |
|
Tobacco products |
-38.5 |
-17.3 |
|
Furniture and fixtures |
-29.5 |
-17.4 |
|
Miscellaneous manufactures |
-11.3 |
-1.5 |
|
Paper and paper products |
-10.8 |
6.0 |
|
Textiles |
-5.6 |
-7.2 |
|
Wood and wood products |
-12.0 |
-12.3 |
|
Publishing and printing |
-2.1 |
-20.3 |
TABLE 1-A Value of Production Index, December 2012 – January 2013
(2000 = 100) (concluded)
|
Gainers |
Month-on-Month Growth (%) |
|
|---|---|---|
| January 2013 |
December 2012
(revised)
|
|
|
Transport equipments |
25.9 |
-33.4 |
|
Food manufacturing |
2.8 |
3.6 |
|
Machinery except electrical |
3.6 |
-1.6 |
|
Rubber and plastic products |
7.0 |
-5.3 |
|
Chemical products |
1.8 |
-2.0 |
|
Textiles |
5.5 |
-2.1 |
|
Miscellaneous manufactures |
4.7 |
-18.2 |
|
Fabricated metal products |
6.2 |
-11.0 |
|
Beverages |
0.5 |
2.5 |
|
Wood and wood products |
4.1 |
-13.8 |
|
Leather products |
3.4 |
-2.7 |
|
Losers |
Month-on-Month Growth (%) |
|
|---|---|---|
| January 2013 |
December 2012
(revised)
|
|
|
Tobacco products |
-59.2 |
-4.4 |
|
Footwear and wearing apparel |
-37.5 |
52.0 |
|
Electrical machinery |
-0.8 |
-7.1 |
|
Basic metals |
-2.8 |
8.4 |
|
Paper and paper products |
-6.1 |
-8.0 |
|
Non-metallic mineral products |
-3.4 |
2.7 |
|
Petroleum products |
-0.7 |
2.7 |
|
Furniture and fixtures |
-2.3 |
-4.6 |
|
Publishing and printing |
-0.5 |
-2.5 |
TABLE 1-B Volume of Production Index, December 2012– January 2013
(2000 = 100)
|
Gainers |
Year-on-Year Growth (%) |
|
|---|---|---|
| January 2013 |
December 2012
(revised)
|
|
|
Food manufacturing |
37.3 |
15.0 |
|
Chemical products |
40.3 |
0.3 |
|
Machinery except electrical |
22.2 |
9.2 |
|
Basic metals |
21.3 |
18.4 |
|
Footwear and wearing apparel |
28.3 |
138.6 |
|
Electrical machinery |
2.7 |
-3.1 |
|
Transport equipment |
10.8 |
-24.8 |
|
Non-metallic mineral products |
13.7 |
4.5 |
|
Rubber and plastic products |
12.5 |
-12.4 |
| Fabricated metal products |
12.8 |
5.7 |
|
Beverages |
3.7 |
-3.2 |
|
Furniture and fixtures |
3.1 |
-0.6 |
|
Leather products |
3.3 |
23.4 |
|
Losers |
Year-on-Year Growth (%) |
|
|---|---|---|
| January 2013 |
December 2012
(revised)
|
|
|
Petroleum products |
-9.5 |
2.6 |
|
Tobacco products |
-33.7 |
-16.9 |
|
Miscellaneous manufactures |
-13.4 |
-1.0 |
|
Publishing and printing |
-20.4 |
-24.9 |
|
Textiles |
-9.7 |
-8.0 |
|
Paper and paper products |
-8.8 |
11.2 |
|
Wood and wood products
|
-13.1 |
-1.2 |
TABLE 1-B Volume of Production Index, December 2012 – January 2013
(2000 = 100) (concluded)
|
Gainers |
Month-on-Month Growth (%) |
|
|---|---|---|
| January 2013 |
December 2012
(revised)
|
|
|
Food manufacturing |
7.8 |
4.9 |
|
Transport equipment |
30.2 |
-31.7 |
|
Machinery except electrical |
8.2 |
-2.0 |
|
Rubber and plastic products |
19.0 |
-5.4 |
|
Chemical products |
2.1 |
-1.7 |
|
Fabricated metal Products |
6.8 |
-10.7 |
|
Furniture and fixtures |
7.9 |
0.9 |
|
Miscellaneous manufactures |
2.0 |
-19.0 |
|
Wood and wood products |
1.4 |
-13.8 |
|
Leather products |
2.1 |
-2.7 |
|
Textiles |
0.2 |
-2.1 |
|
Losers |
Month-on-Month Growth (%) |
|
|---|---|---|
| January 2013 |
December 2012
(revised)
|
|
|
Footwear and wearing apparel |
-40.2 |
48.7 |
|
Tobacco products |
-55.9 |
-4.4 |
|
Beverages |
-6.3 |
2.5 |
|
Electrical machinery |
-1.2 |
-7.6 |
|
Publishing and printing |
-14.2 |
-2.5 |
|
Petroleum products |
-1.5 |
2.4 |
|
Basic metals |
-2.4 |
8.0 |
|
Paper and paper products |
-4.9 |
-7.9 |
|
Non-metallic mineral products |
-0.2 |
2.8
|
TABLE 2-A Value of Net Sales Index, December 2012– January 2013
(2000 =100)
|
Gainers |
Year-on-Year Growth (%) |
|
|---|---|---|
| January 2013 | December 2012
(revised)
|
|
|
Food Manufacturing |
17.3 |
24.4 |
|
Beverages |
28.5 |
10.5 |
|
Electrical machinery |
7.0 |
-0.4 |
|
Footwear and wearing apparel |
41.1 |
210.6 |
|
Chemical products |
13.3 |
-7.7 |
|
Non-metallic mineral products |
35.4 |
59.7 |
|
Transport equipment |
14.5 |
5.8 |
|
Tobacco products |
18.4 |
11.9 |
|
Machinery except electrical |
2.5 |
8.5 |
|
Textiles |
4.7 |
21.5 |
|
Basic metals |
1.2 |
-20.9 |
|
Publishing and printing |
3.9 |
0.4 |
|
Miscellaneous manufactures |
1.9 |
25.7 |
|
Rubber and plastic products |
0.8 |
13.2 |
|
Wood and wood products |
1.5 |
-12.9 |
|
Losers |
Year-on-Year Growth (%) |
|
|---|---|---|
| January 2013 |
December 2012
(revised)
|
|
|
Petroleum products |
-6.6 |
-1.2 |
|
Furniture and Fixtures |
-24.0 |
-25.5 |
|
Fabricated metal products |
-10.7 |
2.9 |
|
Paper and paper products |
-3.3 |
-1.8 |
|
Leather products |
-11.0 |
2.1 |
TABLE 2-A Value of Net Sales Index, December 2012– January 2013
(2000 = 100) (concluded)
|
Gainers |
Month-on-Month Growth (%) |
|
|---|---|---|
| January 2013 |
December 2012
(revised)
|
|
|
Electrical machinery |
5.8 |
2.0 |
|
Transport equipment |
7.4 |
-15.0 |
|
Chemical products |
2.5 |
-3.1 |
|
Furniture and fixtures |
14.5 |
-29.2 |
|
Paper and paper products |
3.5 |
-14.7 |
|
Fabricated metal products |
4.6 |
-5.5 |
|
Wood and wood products |
8.5 |
-5.7 |
|
Tobacco products |
1.3 |
5.7 |
|
Non-metallic mineral products |
0.6 |
-7.3 |
|
Leather products |
2.6 |
5.4 |
|
Textiles |
0.1 |
0.5 |
|
Losers |
Month-on-Month Growth (%) |
|
|---|---|---|
| January 2013 |
December 2012
(revised)
|
|
|
Footwear and wearing apparel |
-38.0 |
47.8 |
|
Food manufacturing |
-6.6 |
5.0 |
|
Petroleum products |
-3.6 |
4.0 |
|
Basic metals |
-5.6 |
-0.2 |
|
Publishing and printing |
-15.2 |
11.8 |
|
Beverages |
-2.7 |
21.1 |
|
Miscellaneous manufactures |
-2.8 |
-5.7 |
|
Machinery except electrical |
-0.2 |
0.6 |
|
Rubber and plastic products |
-1.3 |
0.9 |
TABLE 2-B Volume of Net Sales Index, December 2012– January 2013
(2000 = 100)
|
Gainers |
Year-on-Year Growth (%) |
|
|---|---|---|
| January 2013 |
December 2012
(revised)
|
|
|
Electrical machinery |
38.6 |
12.4 |
|
Food manufacturing |
31.2 |
18.7 |
|
Machinery except electrical |
45.5 |
19.1 |
|
Chemical products |
19.5 |
-4.4 |
|
Non-metallic mineral products |
35.9 |
59.2 |
|
Beverages |
20.1 |
10.2 |
|
Footwear and wearing apparel |
31.3 |
207.4 |
|
Transport equipment |
20.4 |
6.2 |
|
Basic metals |
12.6 |
-12.2 |
|
Tobacco products |
27.5 |
12.4 |
|
Rubber and plastic products |
12.9 |
6.0 |
|
Furniture and fixtures |
11.2 |
-10.4 |
|
Textiles |
0.2 |
20.4 |
|
Wood and wood products |
0.2 |
-1.9 |
|
Losers |
Year-on-Year Growth (%) |
|
|---|---|---|
| January 2013 |
December 2012
(revised)
|
|
|
Petroleum products |
-6.9 |
-4.0 |
|
Publishing and printing |
-15.6 |
-5.4 |
|
Fabricated metal products |
-8.9 |
7.1 |
|
Leather products |
-13.4 |
5.7 |
|
Paper and paper products |
-1.1 |
3.0 |
|
Miscellaneous manufactures |
-0.5 |
26.3 |
TABLE 2-B Volume of Net Sales Index, December 2012 – January 2013
(2000 = 100) (concluded)
|
Gainers |
Month-on-Month Growth (%) |
|
|---|---|---|
| January 2013 |
December 2012
(revised)
|
|
|
Electrical machinery |
21.2 |
1.4 |
|
Machinery except electrical |
30.3 |
0.2 |
|
Transport equipment |
11.1 |
-12.9 |
|
Chemical products |
2.8 |
-2.8 |
|
Furniture and fixtures |
26.5 |
-25.1 |
|
Tobacco products |
9.4 |
5.7 |
|
Non-metallic mineral products |
3.9 |
-7.2 |
|
Rubber and plastic products |
9.8 |
0.8 |
|
Paper and paper products |
4.8 |
-14.7 |
|
Fabricated metal products |
5.1 |
-5.2 |
|
Wood and wood products |
5.6 |
-5.7 |
|
Leather products |
1.3 |
5.3 |
|
Losers |
Month-on-Month Growth (%) |
|
|---|---|---|
| January 2013 |
December 2012
(revised)
|
|
|
Footwear and wearing apparel |
-40.7 |
44.5 |
|
Petroleum products |
-4.4 |
3.7 |
|
Beverages |
-9.3 |
21.1 |
|
Food manufacturing |
-2.0 |
6.3 |
|
Publishing and Printing |
-26.9 |
11.8 |
|
Basic metals |
-5.3 |
-0.6 |
|
Miscellaneous manufactures |
-5.3 |
-6.7 |
|
Textiles |
-4.9 |
0.5 |