
|
Table A Year-on-Year Growth Rates for Production Index, Net Sales Index
and Producer Price Index: January 2015 and January 2014
|
||
|---|---|---|
|
TOTAL MANUFACTURING |
January
2015
|
January
2014
|
|
YEAR-ON-YEAR GROWTH |
|
|
|
Production Index (2000=100) |
|
|
|
Value (VaPI) |
-1.8 |
3.3 |
|
Volume (VoPI) |
3.3 |
4.4 |
|
Net Sales Index (2000=100) |
|
|
|
Value (VaNSI) |
2.8 |
3.9 |
|
Volume (VoNSI) |
8.1 |
5.0 |
|
Producer Price Index (2000=100) |
-4.9r |
-1.1 |
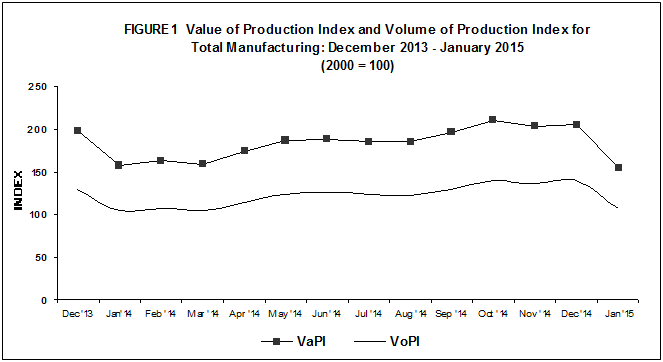
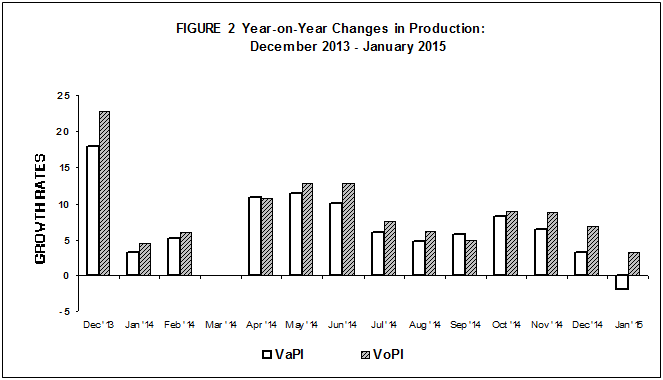
- Value of Production Index slides in January 2015
Value of Production Index (VaPI) slightly decelerated by 1.8 percent in January 2015, according to the preliminary results of the Monthly Integrated Survey of Selected Industries (MISSI). This was due to the decreases in production value observed in seven major sectors, outpacing the increases reported by 13 major sectors. Petroleum products contributed much to the decrease at negative 35.4 percent, followed by other five major sectors that registered two-digit declines. Refer to Tables 1-A and 1.
- Volume of Production accelerates in January 2015
Volume of Production Index (VoPI), in contrast, reflected a year-on-year increment of 3.3 percent in January 2015. The increase was attributed by the output performance of 14 major sectors, with significant increases noted in the following: printing (206.4%), leather products (90.6%), basic metals (50.8%), beverages (49.1%), textiles (38.6%), tobacco products (32.1%), transport equipment (29.3%), non-metallic mineral products (22.3%), wood and wood products (21.5%), paper and paper products (21.4%), and machinery except electrical (13.7%). Refer to Tables 1-B and 2.
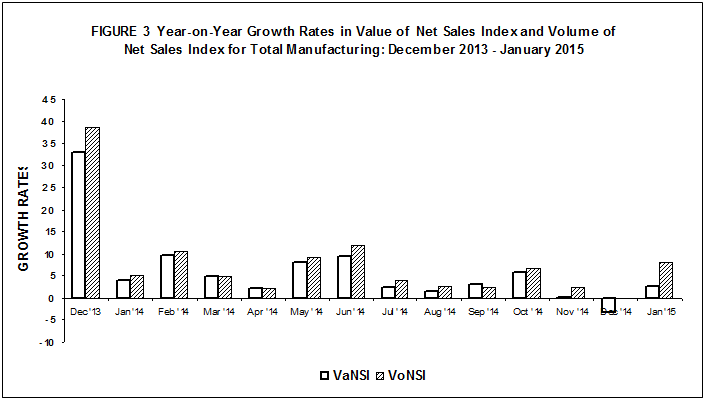
- Value of Net Sales Index posts increments in January 2015
Value of Net Sales Index (VaNSI) posted an annual increase of 2.8 percent in January 2015. This was attributed to the performances in sales value observed in 10 major sectors, with two-digit increases recorded in the following: basic metals (62.0%), chemical products (52.1%), transport equipment (37.0%), furniture and fixtures (36.2%), leather products (21.7%), machinery except electrical (20.6%), printing (17.6%), and tobacco products (10.5%). Refer to Tables 2-A and 3.
- Volume of Net Sales Index picks up in January 2015
Volume of Net Sales Index (VoNSI) climbed to 8.1 percent in January 2015 compared with 5.0 percent growth during the same month last year. Sectors largely contributing to the expansion in VoNSI were observed in the following: furniture and fixtures (71.7%), basic metals (67.6%), chemical products (51.7%), transport equipment (37.4%), leather products (21.8%), machinery except electrical (21.4%), and printing (17.6%). Refer to Tables 2-B and 4.
- Capacity Utilization in January 2015 is 83.2 percent
Average capacity utilization in January 2015 for total manufacturing was recorded at 83.2 percent. About 65 percent or thirteen of the 20 major industries operated at 80 percent and above capacity utilization rates. These are:
- basic metals (88.8%)
- petroleum products (88.5%)
- non-metallic mineral products (86.3%)
- machinery except electrical (84.6%)
- electrical machinery (84.5%)
- food manufacturing (83.7 %)
- paper and paper products (83.2%)
- rubber and plastic products (82.6%)
- wood and wood products (82.5%)
- printing (82.0%)
- leather products (82.0%)
- chemical products (81.4%)
- textiles (81.0%)
The proportion of establishments that operated at full capacity (90% to 100%) was 23.1 percent in January 2015. About 59.7 percent of the establishments operated at 70% to 89% capacity while 17.2 percent of the establishments operated below 70% capacity. Refer to Table 6 and B.
|
Table B Distribution of Key Manufacturing Establishments by Capacity Utilization for Total Manufacturing: January 2015 |
|
|---|---|
|
Capacity Utilization |
Percent Share |
|
Below 50% |
3.4 |
|
50% - 59% |
4.0 |
|
60% - 69% |
9.8 |
|
70% - 79% |
23.0 |
|
80% - 89% |
36.7 |
|
90% - 100% |
23.1 |
- Response Rate
The response rates for the January 2015 MISSI and PPS are 70.2 percent and 82.2 percent, respectively. Refer to Tables 7 and 8.
|
Table C Response Rates For Total Manufacturing
(In percent)
|
||
|---|---|---|
|
|
January 2015 |
December 2014
(Revised)
|
|
MISSI |
70.2 |
90.8r |
|
PPS |
82.2 |
94.4r |
r -revised
Data of non-responding samples were estimated using short term relative of responding samples within the industry class. Revisions to the preliminary estimates are done upon receipt of actual reports of late respondents.
|
Gainers |
Year-on-Year Growth (%) |
|
|---|---|---|
| January 2015 |
December 2014
(revised)
|
|
|
Printing |
206.4 |
269.7 |
|
Beverages |
50.2 |
25.2 |
|
Basic metals |
45.7 |
36.3 |
|
Machinery except electrical |
13.0 |
-4.3 |
|
Transport equipment |
28.9 |
1.6 |
|
Tobacco products |
40.4 |
-16.7 |
|
Textiles |
42.7 |
1.0 |
|
Non-metallic mineral products |
20.5 |
1.6 |
|
Electrical machinery |
2.6 |
-1.2 |
|
Paper and paper products |
17.5 |
-2.7 |
|
Leather products |
90.3 |
-9.0 |
|
Rubber and plastic products |
4.0 |
-2.6 |
|
Wood and wood products |
17.4 |
13.0 |
|
Losers |
Year-on-Year Growth (%) |
|
|---|---|---|
| January 2015 |
December 2014
(revised)
|
|
|
Petroleum products |
-35.4 |
-30.2 |
|
Food manufacturing |
-19.2 |
1.9 |
|
Chemical products |
-14.4 |
9.2 |
|
Footwear and wearing apparel |
-27.1 |
-28.0 |
|
Miscellaneous manufactures |
-16.8 |
-3.8 |
|
Furniture and fixtures |
-23.8 |
-17.5 |
|
Fabricated metal products |
-5.1 |
14.5 |
|
Gainers |
Year-on-Year Growth (%) |
|
|---|---|---|
|
January 2015 |
December 2014
(revised)
|
|
|
Printing |
206.4 |
269.7 |
|
Beverages |
49.1 |
23.2 |
|
Basic metals |
50.8 |
54.6 |
|
Electrical machinery |
8.3 |
-0.1 |
|
Machinery except electrical |
13.7 |
2.7 |
|
Transport equipment |
29.3 |
1.4 |
|
Textiles |
38.6 |
-0.1 |
|
Non-metallic mineral products |
22.3 |
1.6 |
|
Tobacco products |
32.1 |
-25.2 |
|
Paper and paper products |
21.4 |
-3.9 |
|
Leather products |
90.6 |
-11.2 |
|
Wood and wood products |
21.5 |
12.5 |
|
Rubber and plastic products |
1.3 |
-4.6 |
|
Fabricated metal products |
0.1 |
20.2 |
|
Losers |
Year-on-Year Growth (%) |
|
|---|---|---|
|
January 2015 |
December 2014
(revised)
|
|
|
Food manufacturing |
-20.3 |
-1.1 |
|
Chemical products |
-14.6 |
9.2 |
|
Footwear and wearing apparel |
-22.7 |
-25.4 |
|
Petroleum products |
-5.3 |
-4.3 |
|
Miscellaneous manufactures |
-5.3 |
3.5 |
|
Furniture and fixtures |
-3.9 |
-8.1 |
|
Gainers |
Year-on-Year Growth (%) |
|
|---|---|---|
| January 2015 |
December 2014
(revised)
|
|
|
Chemical products |
52.1 |
-9.9 |
|
Basic metals |
62.0 |
33.4 |
|
Machinery except electrical |
20.6 |
-3.1 |
|
Transport equipment |
37.0 |
-2.8 |
|
Furniture and fixtures |
36.2 |
-0.9 |
|
Tobacco products |
10.5 |
31.5 |
|
Printing |
17.6 |
357.8 |
|
Non-metallic mineral products |
2.2 |
-10.8 |
|
Leather products |
21.7 |
18.9 |
|
Rubber and plastic products |
3.3 |
10.3 |
|
Losers |
Year-on-Year Growth (%) |
|
|---|---|---|
|
January 2015
|
December 2014
(revised)
|
|
|
Petroleum products |
-29.8 |
-23.9 |
|
Footwear and wearing apparel |
-32.0 |
-29.0 |
|
Food manufacturing |
-5.2 |
-2.6 |
|
Miscellaneous manufactures |
-12.9 |
-2.2 |
|
Beverages |
-5.5 |
33.8 |
|
Fabricated metal products |
-13.6 |
14.0 |
|
Wood and wood products |
-34.4 |
0.1 |
|
Electrical machinery |
-1.0 |
-1.0 |
|
Paper and paper products |
-5.2 |
1.9 |
|
Textiles |
-0.4 |
20.8 |
TABLE 2-B Volume of Net Sales Index, December 2014– January 2015
(2000 = 100)
|
Gainers |
Year-on-Year Growth (%) |
|
|---|---|---|
|
January 2015
|
December 2014
(revised)
|
|
|
Chemical products |
51.7 |
-9.8 |
|
Basic metals |
67.6 |
51.4 |
|
Machinery except electrical |
21.4 |
4.0 |
|
Transport equipment |
37.4 |
-2.9 |
|
Electrical machinery |
4.4 |
0.1 |
|
Furniture and fixtures |
71.7 |
10.4 |
|
Petroleum products |
2.8 |
4.4 |
|
Printing |
17.6 |
357.8 |
|
Non-metallic mineral products |
3.8 |
-10.8 |
|
Tobacco products |
4.0 |
18.0 |
|
Leather products |
21.8 |
15.9 |
|
Rubber and plastic products |
0.8 |
8.0 |
|
Losers |
Year-on-Year Growth (%) |
|
|---|---|---|
|
January 2015
|
December 2014
(revised)
|
|
|
Food manufacturing |
-6.5 |
-5.4 |
|
Footwear and wearing apparel |
-28.0 |
-26.4 |
|
Beverages |
-6.3 |
31.6 |
|
Wood and wood products |
-32.0 |
-0.3 |
|
Fabricated metal products |
-8.8 |
19.7 |
|
Textiles |
-3.3 |
19.5 |
|
Paper and paper products |
-2.1 |
0.6 |
|
Miscellaneous manufactures |
-0.9 |
5.3 |