
|
Table A Year-on-Year Growth Rates for Production Index, Net Sales Index
and Producer Price Index: July 2015 and July 2014
|
||
|---|---|---|
|
TOTAL MANUFACTURING |
JULY
2015
|
JULY
2014
|
|
Production Index (2000=100) |
|
|
|
Value (VaPI) |
-6.9 |
6.0 |
|
Volume (VoPI) |
-0.5 |
7.6 |
|
Net Sales Index (2000=100) |
|
|
|
Value (VaNSI) |
-6.7 |
2.5 |
|
Volume (VoNSI) |
-0.3 |
4.0 |
|
Producer Price Index (2000=100) |
-6.5r |
-1.5 |
r - revised
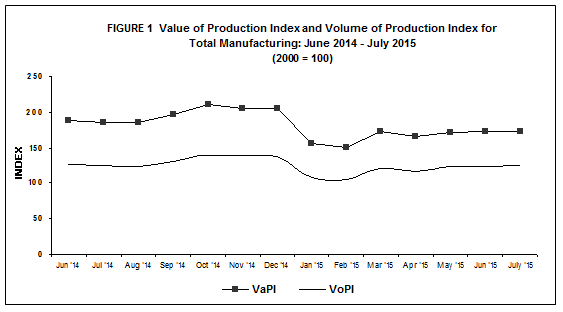
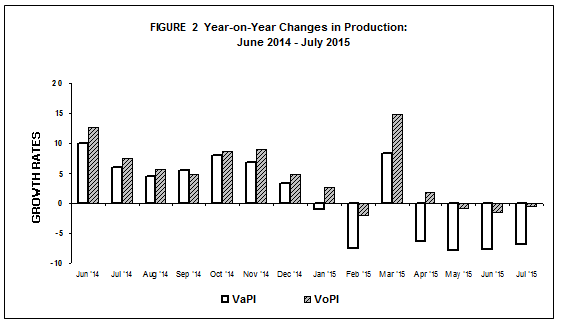
- Value of Production Index decelerates at a slower rate in July 2015
Value of Production Index (VaPI) for total manufacturing dropped by negative 6.9 percent in July 2015, according to the preliminary results of the Monthly Integrated Survey of Selected Industries (MISSI). This was attributed to the decrements noted in eight major sectors, offsetting the increases reported by 12 major sectors. Six major sectors that registered two-digit decreases in VaPI were as follows: wood and wood products (-39.2%), basic metals (-38.7%), furniture and fixtures (-26.8%), food manufacturing (-20.1%), petroleum products (-10.9%), and beverages (-10.1%). Refer to Tables 1-A and 1.
- Volume of Production still at a negative rate
Volume of Production Index (VoPI) slightly fell by 0.5 percent in July 2015 compared with a year ago growth of 7.6 percent. The decreases in six major sectors, pulled down the increases reported by 14 major sectors. Six major sectors exhibiting two-digit decreases in VoPI were basic metals (-31.4%), wood and wood products (-24.4%), food manufacturing (-20.4%), beverages (-17.4%), furniture and fixtures (-10.7%), and machinery except electrical (-10.7%). Refer to Tables 1-B and 2.
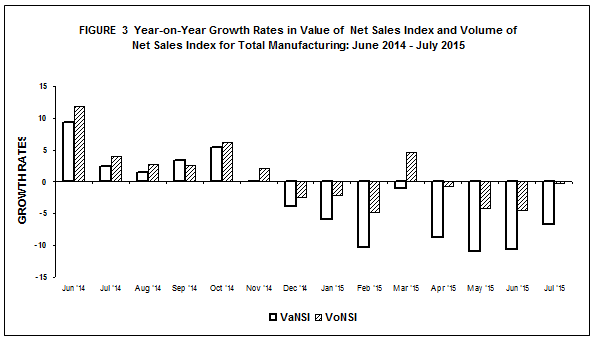
- Value of Net Sales Index contracts in July 2015
Value of Net Sales Index (VaNSI) depicted an annual drop of 6.7 percent in July 2015 compared with the single-digit increase of 2.5 percent during the same month of last year. The contraction in VaNSI were exhibited by fifty percent of the 20 major sectors, with two-digit decreases noted in the following: printing (-46.5%), basic metals (-27.9%), food manufacturing (-15.7%) and petroleum products (-14.7%). Refer to Tables 2-A and 3.
- Volume of Net Sales Index likewise declines
Volume of Net Sales Index (VoNSI) also slid down, recording a minimal decrease of 0.3 percent in July 2015. This was primarily due to the decreases in VoNSI observed in seven major sectors led by printing (-45.6%), outpacing the decrements of 13 major sectors. Two other major sectors that contributed to the shortfall in VoNSI were observed in basic metals (-19.3%) and food manufacturing (-16.0%). Refer to Tables 2-B and 4.
- Average Capacity Utilization Rate in July 2015 remains at 83.3 percent
Average capacity utilization rate in July 2015 for total manufacturing was recorded at 83.3 percent. Fifty-five percent or 11 of the 20 major industries operated at 80 percent and above capacity utilization rates. These were:
- petroleum products (88.4%)
- basic metals (88.2%)
- non-metallic mineral products (86.3%)
- machinery except electrical (84.8%)
- electrical machinery (84.5%)
- food manufacturing (84.0%)
- chemical products (83.5%)
- paper and paper products (83.1%)
- rubber and plastic products (82.5%)
- wood and wood products (80.6%)
- printing (80.2%)
The proportion of establishments that operated at full capacity (90% to 100%) was 26.5 percent in July 2015. About 55.1 percent of the establishments operated at 70 percent to 89 percent capacity while 18.4 percent of the establishments operated below 70 percent capacity. Refer to Table 6 and B.
|
Table B Distribution of Key Manufacturing Establishments by Capacity Utilization for Total Manufacturing: July 2015 |
|
|---|---|
|
Capacity Utilization |
Percent Share |
|
Below 50% |
3.5 |
|
50% - 59% |
4.4 |
|
60% - 69% |
10.5 |
|
70% - 79% |
21.4 |
|
80% - 89% |
33.7 |
|
90% - 100% |
26.5 |
- Industry Coverage
The 2015 MISSI utilizes the 2009 Philippine Standard Industrial Classification (PSIC) to classify major industries and sub-industries. Twenty major industries of the 2009 PSIC were formed to comprise the industry coverage of the 2015 MISSI. These are presented in the table below.
|
2009 PSIC CODE |
INDUSTRY DESCRIPTION |
|---|---|
|
C10 |
Food manufacturing * |
|
C11 |
Beverages |
|
C12 |
Tobacco products |
|
C13 |
Textiles* |
|
C14, C152 |
Footwear and wearing apparel |
|
C151 |
Leather products |
|
C16 |
Wood and wood products* |
|
C17 |
Paper and paper products |
|
C18 |
Printing |
|
C19 |
Petroleum products* |
|
C20,C21 |
Chemical products* |
|
C22 |
Rubber and plastic products* |
|
C23 |
Non-metallic mineral products* |
|
C24 |
Basic metals* |
|
C25,C3311 |
Fabricated metal products |
|
C262,C275,C28, C263,C268,C3312,C332 |
Machinery except electrical* |
|
C261,C264,C27, C29301,C3314,C332 |
Electrical machinery* |
|
C29 except C29301, C30,C3315 |
Transport equipment |
|
C31 |
Furniture and fixtures |
|
C265,C266,C267,C32, C3313,C3319 |
Miscellaneous manufactures |
|
Note: * - Major industries categorized into sub-industries |
|
- Response Rate
The response rates for the July 2015 MISSI and PPS are 76.0 percent and 83.1 percent, respectively. Refer to Tables 7 and 8.
|
Table C Response Rates For Total Manufacturing
(In percent)
|
||
|---|---|---|
|
|
July 2015 |
June 2015
(Revised)
|
|
MISSI |
76.0 |
87.6r |
|
PPS |
83.1 |
91.1r |
Data of non-responding samples were estimated using short-term geometric mean of the relative values of responding samples within the industry class. Revisions to the preliminary estimates are done upon receipt of actual reports of late respondents.
(Sgd.) LISA GRACE S. BERSALES, Ph.D.
National Statistician
TABLE 1-A Value of Production Index, June 2015– July 2015
(2000 =100)
|
Gainers |
Year-on-Year Growth (%) |
|
|---|---|---|
| July 2015 |
June 2015
(revised)
|
|
|
Chemical products |
11.2 |
16.5 |
|
Miscellaneous manufactures |
22.4 |
26.0 |
|
Non-metallic mineral products |
13.0 |
15.7 |
|
Footwear and wearing apparel |
8.6 |
-3.5 |
|
Textiles |
9.6 |
13.3 |
|
Fabricated metal products |
9.9 |
9.6 |
|
Transport equipment |
3.1 |
8.8 |
|
Paper and paper products |
4.9 |
6.1 |
|
Rubber and plastic products |
2.8 |
-1.2 |
|
Tobacco products |
3.5 |
0.2 |
|
Printing |
1.7 |
-6.7 |
|
Leather products |
3.8 |
9.4 |
|
Losers |
Year-on-Year Growth (%) |
|
|---|---|---|
| July 2015 |
June 2015
(revised)
|
|
|
Food manufacturing |
-20.1 |
-15.8 |
|
Basic metals |
-38.7 |
-37.2 |
|
Petroleum products |
-10.9 |
-30.1 |
|
Electrical machinery |
-5.3 |
-9.5 |
|
Machinery except electrical |
-8.2 |
-2.7 |
|
Beverages |
-10.1 |
0.6 |
|
Wood and wood products |
-39.2 |
-28.4 |
|
Furniture and fixtures |
-26.8 |
-27.4 |
Notes:
TABLE 1-B Volume of Production Index, June 2015– July 2015
(2000 = 100)
|
Gainers |
Year-on-Year Growth (%) |
|
|---|---|---|
| July 2015 |
June 2015
(revised)
|
|
|
Electrical machinery |
14.0 |
10.4 |
|
Petroleum products |
19.6 |
-13.0 |
|
Chemical products |
9.7 |
14.3 |
|
Non-metallic mineral products |
19.8 |
23.8 |
|
Miscellaneous manufactures |
14.8 |
24.3 |
|
Footwear and wearing apparel |
8.6 |
-2.4 |
|
Transport equipment |
5.3 |
11.6 |
|
Rubber and plastic products |
6.0 |
-0.7 |
|
Textiles |
8.2 |
12.1 |
|
Fabricated metal products |
7.6 |
12.5 |
|
Tobacco products |
2.5 |
-0.7 |
|
Paper and paper products |
2.4 |
3.5 |
|
Printing |
3.4 |
-5.0 |
|
Leather products |
3.0 |
8.8 |
|
Losers |
Year-on-Year Growth (%) |
|
|---|---|---|
| July 2015 |
June 2015
(revised)
|
|
|
Food manufacturing |
-20.4 |
-15.9 |
|
Basic metals |
-31.4 |
-33.2 |
|
Machinery except electrical |
-10.7 |
-3.4 |
|
Beverages |
-17.4 |
-7.6 |
|
Wood and wood products |
-24.4 |
-9.5 |
|
Furniture and fixtures |
-10.7 |
-14.8 |
Notes:
TABLE 2-A Value of Net Sales Index, June 2015– July 2015
(2000 =100)
|
Gainers |
Year-on-Year Growth (%) |
|
|---|---|---|
| July 2015 |
June 2015
(revised)
|
|
|
Transport equipment |
28.8 |
16.3 |
|
Beverages |
17.4 |
18.5 |
|
Miscellaneous manufactures |
32.3 |
21.7 |
|
Non-metallic mineral products |
13.3 |
15.3 |
|
Tobacco products |
15.8 |
11.9 |
|
Machinery except electrical |
3.0 |
5.9 |
|
Fabricated metal products |
18.8 |
16.0 |
|
Rubber and plastic products |
12.3 |
8.9 |
|
Paper and paper products |
5.5 |
-2.8 |
|
Wood and wood products |
6.2 |
6.1 |
|
Losers |
Year-on-Year Growth (%) |
|
|---|---|---|
| July 2015 |
June 2015
(revised)
|
|
|
Food manufacturing |
-15.7 |
-16.7 |
|
Petroleum products |
-14.7 |
-26.4 |
|
Basic metals |
-27.9 |
-33.2 |
|
Chemical products |
-7.0 |
-6.9 |
|
Printing |
-46.5 |
-45.5 |
|
Electrical machinery |
-1.0 |
-8.9 |
|
Footwear and wearing apparel |
-4.5 |
-11.1 |
|
Textiles |
-4.8 |
-5.6 |
|
Furniture and fixtures |
-8.5 |
-2.4 |
|
Leather products |
-2.0 |
13.5 |
Notes:
TABLE 2-B Volume of Net Sales Index, June 2015– July 2015
(2000 = 100)
|
Gainers |
Year-on-Year Growth (%) |
|
|---|---|---|
| July 2015 |
June 2015
(revised)
|
|
|
Electrical machinery |
19.2 |
11.0 |
|
Petroleum products |
14.5 |
-8.4 |
|
Transport equipment |
31.5 |
19.3 |
|
Non-metallic mineral products |
20.2 |
23.4 |
|
Miscellaneous manufactures |
24.1 |
20.0 |
|
Beverages |
7.9 |
8.8 |
|
Tobacco products |
14.7 |
10.9 |
|
Fabricated metal products |
16.3 |
19.1 |
|
Rubber and plastic products |
15.8 |
9.4 |
|
Wood and wood products |
32.0 |
34.0 |
|
Furniture and fixtures |
11.5 |
14.5 |
|
Paper and paper products |
2.9 |
-5.1 |
|
Machinery except electrical |
0.3 |
5.1 |
|
Losers |
Year-on-Year Growth (%) |
|
|---|---|---|
| July 2015 |
June 2015
(revised)
|
|
|
Food manufacturing |
-16.0 |
-16.8 |
|
Basic metals |
-19.3 |
-28.9 |
|
Chemical products |
-8.3 |
-8.7 |
|
Printing |
-45.6 |
-44.6 |
|
Footwear and wearing apparel |
-4.5 |
-10.0 |
|
Textiles |
-5.9 |
-6.6 |
|
Leather products |
-2.8 |
12.9 |
Notes: