
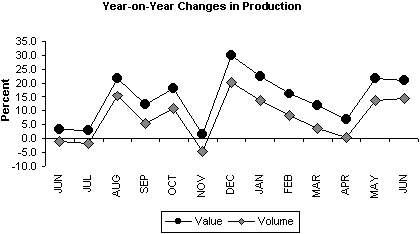
- Manufacturing Output Continued to Improve
Manufacturing output continued to improve in June 2000 as it posted 20.9 percent and 14.3 percent increases in their value of production index (VaPI) and volume of production index (VoPI), respectively, according to the preliminary results of the Monthly Integrated Survey of Selected Industries (MISSI). However, these improvements still did not surpass the significant growths recorded in December 1999. The manufacturing industry appeared to be performing positively since the start of the year 2000.
Petroleum products contributed to the gains in the value of production while electrical machinery, to the production volume.
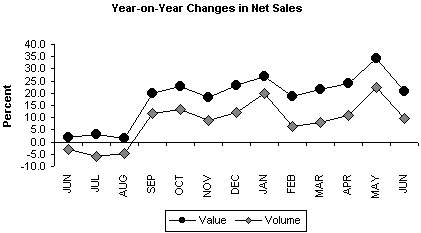
- Net Sales on Upward Trend
Net sales, which have been moving positively, moved up in June 2000 with both value and volume growing by 20.8 percent and 9.8 percent, respectively. Miscellaneous manufactures was the top gainer in terms of value and volume of net sales which climbed by 161.8 percent and 195.3 percent. Losers were wood and wood products, declining by 35.4 percent in both its value and volume of net sales; food manufacturing, declining by 7.1 percent in its value of net sales; and textile, declining by 15.6 percent in its volume.
- Capacity Utilization up at 82.3%
Average capacity utilization for June 2000 for manufacturing was estimated at 82.3 percent. This was up by 2.0 percentage points over the 80.3 percent rate in June 1999. Ten out of 16 sectors improved in terms of capacity utilization rate compared to the utilization rates of the same month last year. Petroleum refineries had the highest capacity utilization rate of 95.0 percent while textile posted the lowest capacity utilization rate of 71.7 percent.
- Value of Production
In June 2000, the value of production index (VaPI) of 622.2 increased by 20.9 percent from 514.6 in June 1999. Year-on year increases were observed in 10 out of 16 major sectors led by paper and paper products, which increased by 55.3 percent (See Annex 1-A). Other sectors contributing to the growth of value of production were the following: furniture and fixtures (48.3%), petroleum refineries (44.5%), electrical machinery (38.1%), other manufacturing (18.0%), transport equipment (15.7%), non-metallic mineral products (13.6%), beverage (9.0%), chemicals (4.8%) and tobacco (2.9%).
On the other hand, sectors that declined in their value of production were rubber products (-18.0%), textile (-11.3%), food manufacturing (-9.6%), basic metals (-3.6%), wearing apparel (-0.6%) and wood and wood products (-0.3%).
- Volume of Production
The volume of production index (VoPI) for total manufacturing increased by 14.3 percent to 166.4 from 145.5 of the same month last year. Ten out of 16 sectors posted year-on-year increases led by paper and paper products with 52.5 percent increase. (See Annex 1-B). Other sectors which contributed to the positive performance were furniture and fixtures (48.3%), electrical machinery (37.1%), other manufacturing (33.1%), transport equipment (10.6%), beverage (7.7%), non-metallic mineral (4.0%), tobacco (3.9%), petroleum refineries (3.2%) and chemical (3.1%). The increases in the production output of these sectors can be attributed to the growing demand for the products from both domestic and export markets.
On the other hand, sectors, which exhibited negative performance, were textile (-29.1%), rubber products (-16.7%), food manufacturing (-5.5%), basic metals (-4.4%), wearing apparel (-0.6%), and wood and wood products (-0.3%). Slowdown in the production in these sectors can be attributed to temporary or partial shutdowns in the operation of some establishments due to unavailability of raw materials and strikes caused by some labor disputes, and decrease in the demand for the products.
- Value of Net Sales
The value of net sales for June 2000 increased by 20.8 percent compared to the same month last year. Twelve out of 16 major sectors showed improvements in their value of net sales. Leading sector was miscellaneous manufactures registering a 161.8 percent growth over the same month last year (See Annex 2-A). Other sectors that recorded increases were petroleum products (76.6%), paper and paper products (58.9%), non-metallic mineral products (40.0%), furniture and fixtures (38.5%), basic metals (17.2%), beverages (17.0%), tobacco (15.2%), wearing apparel (10.8%), transport equipment (10.6%), chemicals (10.5%), and textile (5.6%).
On the other hand, sectors with lower value of net sales compared to the same month last year were wood & wood products (-35.4%), food manufacturing (-7.1%), rubber products (-6.1%) and electrical machinery (-4.6%).
- Volume of Net Sales
The volume of net sales for June 2000 increased by 9.8 percent over the same month last year. Increases were observed in 11 out of 16 sectors led by miscellaneous manufactures which increased by 195.3 percent (See Annex 2-B). Other sectors that exhibited increases were paper and paper products (56.0%), non-metallic mineral products (40.5%), furniture and fixtures (38.5%), petroleum products (26.1%), tobacco (16.4%), beverages (15.7%), basic metals (14.9%), wearing apparel (10.9%), chemicals (8.7%), transport equipment (5.8%).
On the other hand, decreases were observed in the following sectors: wood and wood products (-35.4%), textile (-15.6%), electrical machinery (-5.3%), rubber products (-4.6%) and food manufacturing (-2.9%).
- Capacity Utilization
The proportion of responding establishments that operated at full capacity (90%-100%) in June 2000 has improved from 15.5 percent of the same month last year to 32.9 percent (See Annex 3-A). About 39.8 percent operated below 70 percent capacity rate, lower by 3.8 percentage points from 43.6 percent in June 1999.
The June 2000 average capacity utilization rate for manufacturing was estimated at 82.3 percent, higher than the 80.3 percent posted last year (See Annex 3B). Of the 16 sectors, ten sectors posted higher capacity utilization rates compared to its utilization rates a year ago. Leading sector was petroleum refineries, which recorded an average capacity utilization rate of 95.0 percent. Other sectors which registered more than 80 percent capacity utilization rates were furniture and fixtures (92.6%), paper and paper products (91.7%), electrical machinery (91.0%), beverage (84.4%), miscellaneous manufactures (82.8%),.wearing apparel (80.9%) and non-metallic mineral products (80.5%)
- Response Rate
These results were based on the response of 368 sample establishments, which comprised 70.8 percent of the total number of establishments covered by the survey.
ANNEX 1-A
VALUE OF PRODUCTION INDEX (JUNE 2000)
YEAR-ON-YEAR
GAINERS GROWTH % June May r Petroleum Refineries 44.5 42.7 Electrical Machinery 38.1 55.7 Paper & Paper Products 55.3 30.9 Transport Equipment 15.7 19.1 Non-Metallic Mineral Products 13.6 -3.0 Chemicals 4.8 1.2 Furniture & Fixtures 48.3 132.6 Beverage 9.0 -4.6 Other Manufacturing 18.0 32.2 Tobacco 2.9 17.3 LOSERS Food Manufacturing -9.6 -21.9 Textile -11.3 -25.3 Rubber Products -18.0 8.9 Basic Metals -3.6 -12.8 Wearing Apparel -0.6 -2.1 Wood & Wood Products -0.3 -10.5 MONTH-ON-MONTH GAINERS GROWTH % June May r Food Manufacturing 10.2 -15.5 Wearing Apparel 16.3 -5.6 Textile 13.3 -2.7 Electrical Machinery 6.2 62.8 Chemicals 5.2 18.2 Non-Metallic Mineral Products 8.6 -13.3 Beverage 13.8 -5.3 Petroleum Refineries 0.9 6.6 Paper & Paper Products 4.1 6.7 Furniture & Fixtures 14.8 17.6 LOSERS Wood & Wood Products -8.3 19.2 Basic Metals -3.1 13.1 Rubber Products -10.1 7.0 Transport Equipment -3.0 2.5 Other Manufacturing -12.1 8.1 Tobacco -5.5 1.1 Note: Sectors are ranked according to their contribution to the overall June 2000 growth rate.
r - revised due to updating of data from late responding establishments.
ANNEX 1-B
VOLUME OF PRODUCTION INDEX (JUNE 2000)
YEAR-ON-YEAR GAINERS GROWTH (%) June May r Electrical Machinery 37.1 46.3 Paper & Paper Products 52.5 26.5 Petroleum Refineries 3.2 0.9 Transport Equipment 10.6 13.6 Chemical 3.1 -2.9 Furniture & Fixtures 48.3 132.6 Beverage 7.7 -6.6 Other Manufacturing 33.1 48.3 Non-Metallic Mineral 4.0 -14.3 Tobacco 3.9 18.5 LOSERS Textile -29.1 -40.4 Food Manufacturing -5.5 -18.2 Basic Metals -4.4 -18.5 Rubber Products -16.7 11.2 Wearing Apparel -0.6 -4.6 Wood & Wood Products -0.3 -10.5 MONTH-ON-MONTH GAINERS GROWTH % June May r Food Manufacturing 10.9 -15.7 Electrical Machinery 11.5 53.4 Textile 13.3 -2.7 Chemicals 5.4 18.8 Non-Metallic Mineral 13.8 -15.0 Wearing Apparel 7.3 -6.6 Beverage 13.8 -5.5 Paper & Paper Products 4.1 6.7 Furniture & Fixtures 14.8 17.6 LOSERS Wood & Wood Products -8.3 19.2 Petroleum Refineries -1.1 6.6 Rubber Products -10.1 6.3 Basic Metals -2.1 16.2 Transport Equipment -3.0 2.2 Other Manufacturing -12.9 8.0 Tobacco -5.5 1.1 Note: Sectors are ranked according to their contribution to the overall June 2000 growth rate.
r - revised due to updating of data from late responding establishments.
ANNEX 2-A
NET SALES VALUE (JUNE 2000)
YEAR-ON-YEAR GAINERS GROWTH (%) June May Petroleum Products 76.6 53.8 Paper & paper products 58.9 23.4 Non-metallic mineral products 40.0 23.2 Basic metals 17.2 45.7 Chemicals 10.5 5.8 Miscellaneous Manufactures 161.8 -1.0 Wearing Apparel 10.8 39.2 Transport equipment 10.6 49.2 Beverages 17.0 14.6 Textile 5.6 -11.4 Furniture & Fixtures 38.5 60.0 Tobacco 15.2 13.8 LOSERS Food Manufacturing -7.1 0.4 Wood & wood products -35.4 -21.5 Electrical Machinery -4.6 128.2 Rubber products -6.1 -4.1 MONTH-ON-MONTH GAINERS GROWTH % June May Petroleum Products 20.6 -0.7 Chemicals 13.6 6.8 Transport equipment 28.7 69.4 Basic metals 10.3 56.1 Miscellaneous Manufactures 143.3 -25.8 Textile 9.2 6.0 Non-metallic mineral products 12.7 5.6 Beverages 16.1 -7.4 Food Manufacturing 1.4 13.1 Paper & paper products 4.6 15.0 Furniture & Fixtures 14.3 26.9 LOSERS Electrical Machinery -49.8 81.0 Wood & wood products -19.4 6.2 Wearing Apparel -4.8 -3.8 Rubber products -10.4 -5.8 Tobacco -4.5 5.7 Note: Sectors are ranked according to their contribution to the overall June 2000 growth rate.
ANNEX 2-B
NET SALES VOLUME (JUNE 2000)
YEAR-ON-YEAR GAINERS GROWTH % June May Petroleum Products 26.1 8.8 Paper & paper products 56.0 19.2 Non-metallic mineral products 40.5 24.1 Basic metals 14.9 43.7 Miscellaneous Manufactures 195.3 11.0 Chemicals 8.7 1.5 Wearing Apparel 10.9 35.7 Beverages 15.7 12.2 Transport equipment 5.8 42.3 Furniture & Fixtures 38.5 60.0 Tobacco 16.4 14.9 LOSERS Wood & wood products -35.4 -21.5 Textile -15.6 -29.2 Food Manufacturing -2.9 5.2 Electrical Machinery -5.3 114.4 Rubber products -4.6 -2.0 MONTH-ON-MONTH GAINERS GROWTH % June May Petroleum Products 18.2 -0.7 Chemicals 13.7 7.4 Transport equipment 28.7 69.0 Basic metals 10.3 57.2 Miscellaneous Manufactures 143.1 -25.8 Textile 9.2 5.9 Non-metallic mineral products 12.7 5.6 Beverages 16.1 -7.6 Food Manufacturing 1.3 12.7 Paper & paper products 4.6 15.0 Furniture & Fixtures 14.3 26.9 LOSERS Electrical Machinery -47.4 70.5 Wood & wood products -19.4 6.2 Wearing Apparel -7.8 -4.9 Rubber Products -10.4 -6.4 Tobacco -4.5 5.7 Note: Sectors are ranked according to their contribution to the overall June 2000 growth rate.


ANNEX 4
Percentage Changes in Production and Net Sales of Key Enterprises: June 1999 � June 2000
| 1999 | 2000 | ||||||||||||
| ITEM | JUN | JUL | AUG | SEP | OCT | NOV | DEC | JAN | FEB | MAR | APR | MAY | JUNE |
| Year-on-Year Change Production Value Volume Net Sales Value Volume |
3.3 r 2.0 |
2.9 r 3.1 |
21.8 r 1.4 |
12.1 r 20.1 |
18.2 r 22.9 |
1.5 r 18.2 |
30.0 r 23.4 |
22.4 r 26.8 |
16.2 r 18.8 |
11.7 r 21.5 |
6.9 r 24.1 |
21.8 r 34.2 |
20.9 20.8 |
| Month-on-Month Change Production Value Volume Net Sales Value Volume |
5.4 r 3.7 |
-3.9 r 2.5 |
14.0 r -2.8 |
-3.0 r 12.6 |
0.2 r 1.6 |
-16.1 r -2.9 |
21.0 r 3.9 |
-3.3 r -3.5 |
2.5 r -0.9 |
6.6 r 16.5 |
-15.2 r -12.5 |
19.6 r 19.8 |
4.6 3.3 |
r - revised due to updating of data from late responding establishments
Source: National Statistics Office
Manila, Philippines