
|
Table A Year-on-Year Growth Rates for Production Index, Net Sales Index
and Producer Price Index: June 2016 and June 2015
|
||
|---|---|---|
|
TOTAL MANUFACTURING |
JUNE
2016
|
JUNE
2015
|
|
Production Index (2000=100) |
|
|
|
Value (VaPI) |
4.7 |
-7.9 |
|
Volume (VoPI) |
8.5 |
-1.7 |
|
Net Sales Index (2000=100) |
|
|
|
Value (VaNSI) |
3.4 |
-8.5 |
|
Volume (VoNSI) |
7.1 |
-2.3 |
|
Producer Price Index (2000=100) |
-3.5r |
-6.3 |
r - revised
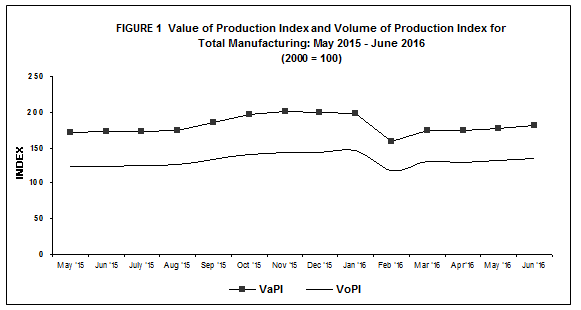
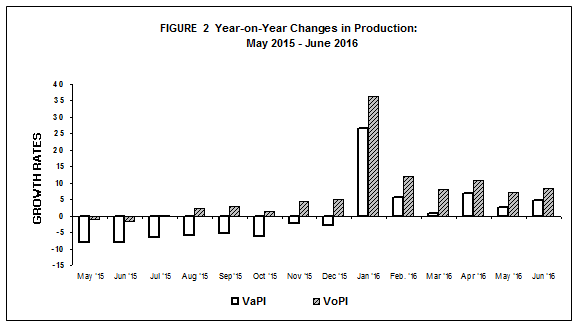
- Value of Production Index rebounds in June 2016
Value of Production Index (VaPI) for total manufacturing made a turnaround as it grew by 4.7 percent in June 2016 from negative 7.9 percent posted during the same period a year ago, according to the preliminary results of the Monthly Integrated Survey of Selected Industries (MISSI). There were eight major sectors that mainly influenced the increase in VaPI by posting two-digit increases, namely: basic metals (58.7%), transport equipment (41.4%), tobacco products (27.5%), rubber and plastic products (25.0%), beverages (21.4%), wood and wood products (15.5%), machinery except electrical (13.3%) and printing (10.2%). Refer to Tables 1-A and 1.
- Volume of Production likewise recovers
Volume of Production Index (VoPI) climbed by 8.5 percent in June 2016 compared with the 1.7 percent decrease in the year-ago figure. This was brought about by the increments in 10 major sectors led by basic metals, registering a two-digit growth of 76.9 percent. Other major sectors with two-digit increases were observed in the following: transport equipment (39.7%), machinery except electrical (33.9%), rubber and plastic products (31.2%), tobacco products (27.5%), wood and wood products (16.8%), beverages (16.2%) and printing (10.9%). Refer to Tables 1-B and 2.
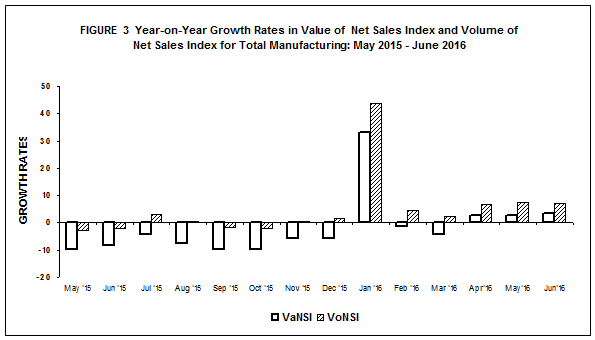
- Value of Net Sales Index rises in June 2016
Value of Net Sales Index (VaNSI) rebounded in June 2016 as it registered an increase of 3.4 percent compared with 8.5 percent drop during the same month last year. Seven of the 12 major sectors that pulled-up the VaNSI showed significant increases as follows: basic metals (47.3%), wood and wood products (37.8%), beverages (24.1%), non-metallic mineral products (19.0%), paper and paper products (18.5%), machinery except electrical (18.4%) and rubber and plastic products (15.8%). Refer to Tables 2-A and 3.
- Volume of Net Sales Index also expands
Volume of Net Sales Index (VoNSI) likewise rose in June 2016 registering a year-on-year increment of 7.1 percent from negative 2.3 percent recorded during the same month of 2015. This is explained by the substantial contribution in VoNSI of the following major sectors: basic metals (64.1%), machinery except electrical (40.0%), wood and wood products (39.3%), rubber and plastic products (21.6%), furniture and fixtures (21.3%), beverages (18.8%), non-metallic mineral products (16.6%), paper and paper products (16.4%) and leather products (13.2%). Refer to Tables 2-B and 4.
- Average Capacity Utilization Rate in June 2016 is 83.5 percent with basic metals posting the highest among industries
Average capacity utilization rate in June 2016 for total manufacturing was recorded at 83.5 percent. Fifty-five percent or 11 of the 20 major industries operated at 80 percent and above capacity utilization rates. These were:
- basic metals (88.7%)
- petroleum products (88.2%)
- non-metallic mineral products (86.6%)
- machinery except electrical (85.3%)
- food manufacturing (84.5%)
- electrical machinery (84.3%)
- chemical products (83.2%)
- paper and paper products (83.1%)
- rubber and plastic products (82.9%)
- wood and wood products (81.1%)
- printing (80.4%)
The proportion of establishments that operated at full capacity (90% to 100%) was 23.8 percent in June 2016. About 58.38 percent of the establishments operated at 70 percent to 89 percent capacity while 17.9 percent of the establishments operated below 70 percent capacity. Refer to Table B and 6.
|
Table B Distribution of Key Manufacturing Establishments by Capacity Utilization for Total Manufacturing: June 2016 |
|
|---|---|
|
Capacity Utilization |
Percent Share |
|
Below 50% |
3.3 |
|
50% - 59% |
5.0 |
|
60% - 69% |
9.6 |
|
70% - 79% |
23.7 |
|
80% - 89% |
34.6 |
|
90% - 100% |
23.8 |
- Industry Coverage
The 2016 MISSI utilizes the 2009 PSIC to classify major industries and sub-industries. Twenty major industries of the 2009 PSIC were formed to comprise the industry coverage of the 2016 MISSI. These are presented in the table below.
|
2009 PSIC CODE |
INDUSTRY DESCRIPTION |
|---|---|
|
C10 |
Food manufacturing * |
|
C11 |
Beverages |
|
C12 |
Tobacco products |
|
C13 |
Textiles* |
|
C14, C152 |
Footwear and wearing apparel |
|
C151 |
Leather products |
|
C16 |
Wood and wood products* |
|
C17 |
Paper and paper products |
|
C18 |
Printing |
|
C19 |
Petroleum products* |
|
C20,C21 |
Chemical products* |
|
C22 |
Rubber and plastic products* |
|
C23 |
Non-metallic mineral products* |
|
C24 |
Basic metals* |
|
C25,C3311 |
Fabricated metal products |
|
C262,C275,C28, C263,C268,C3312,C332 |
Machinery except electrical* |
|
C261,C264,C27, C29301,C3314,C332 |
Electrical machinery* |
|
C29 except C29301, C30,C3315 |
Transport equipment |
|
C31 |
Furniture and fixtures |
|
C265,C266,C267,C32, C3313,C3319 |
Miscellaneous manufactures |
|
Note: * - Major industries categorized into sub-industries |
|
- Response Rate
The response rates for the June 2016 MISSI and PPS are 77.3 and 85.5 percent, respectively. Refer to Tables 7 and 8.
|
Table C Response Rates for Total Manufacturing
(In percent)
|
||
|---|---|---|
|
|
June 2016 |
May 2016
(Revised)
|
|
MISSI |
77.3 |
87.9r |
|
PPS |
85.5r |
90.0r |
r - revised
Data of non-responding samples were estimated using short-term geometric mean of the relative values of responding samples within the industry class. Revisions to the preliminary estimates are done upon receipt of actual reports of late respondents.
FOR THE NATIONAL STATISTICIAN:
TABLE 1-A Value of Production Index, May 2016 and June 2016
(2000 =100)
|
Gainers |
Year-on-Year Growth (%) |
|
|---|---|---|
| June 2016 |
May 2016
(revised)
|
|
|
Basic metals |
58.7 |
25.0 |
|
Transport equipment |
41.4 |
19.3 |
|
Machinery except electrical |
13.3 |
18.1 |
|
Beverages |
21.4 |
9.6 |
|
Rubber and plastic products |
25.0 |
27.6 |
|
Food manufacturing |
3.4 |
18.0 |
|
Tobacco products |
27.5 |
5.1 |
|
Chemical products |
3.1 |
3.4 |
|
Printing |
10.2 |
-15.6 |
|
Wood and wood products |
15.5 |
8.7 |
|
Losers |
Year-on-Year Growth (%) |
|
|---|---|---|
| June 2016 |
May 2016
(revised)
|
|
|
Petroleum products |
-14.8 |
-36.7 |
|
Electrical machinery |
-4.4 |
-5.1 |
|
Fabricated metal products |
-35.9 |
-21.8 |
|
Footwear and wearing apparel |
-12.5 |
-8.9 |
|
Textiles |
-17.7 |
-18.0 |
|
Leather products |
-85.1 |
-83.2 |
|
Furniture and fixtures |
-17.7 |
-20.3 |
|
Paper and paper products |
-2.1 |
2.1 |
|
Non-metallic mineral products |
-1.4 |
-3.3 |
|
Miscellaneous manufactures |
-0.7 |
8.8 |
TABLE 1-B Volume of Production Index, May 2016 and June 2016
(2000 = 100)
|
Gainers |
Year-on-Year Growth (%) |
|
|---|---|---|
| June 2016 |
May 2016
(revised)
|
|
|
Basic metals |
76.9 |
42.5 |
|
Machinery except electrical |
33.9 |
44.8 |
|
Transport equipment |
39.7 |
19.7 |
|
Rubber and plastic products |
31.2 |
34.0 |
|
Beverages |
16.2 |
4.9 |
|
Tobacco products |
27.5 |
5.1 |
|
Food manufacturing |
2.0 |
16.1 |
|
Chemical products |
4.1 |
3.8 |
|
Printing |
10.9 |
-15.3 |
|
Wood and wood products |
16.8 |
9.7 |
|
Losers |
Year-on-Year Growth (%) |
|
|---|---|---|
|
June 2016
(revised) |
May 2016
(revised) |
|
|
Electrical machinery |
-3.9 |
-4.1 |
| Fabricated metal products |
-36.8 |
-22.8 |
|
Petroleum products |
-4.4 |
-26.7 |
|
Textiles |
-18.3 |
-18.9 |
|
Footwear and wearing apparel |
-9.8 |
-2.9 |
|
Leather products |
-84.6 |
-82.0 |
|
Miscellaneous manufactures |
-6.5 |
2.3 |
|
Non-metallic mineral products |
-3.4 |
-5.2 |
|
Paper and paper products |
-3.9 |
0.4 |
|
Furniture and fixtures |
-2.7 |
-6.4 |
TABLE 2-A Value of Net Sales Index, May 2016 and June 2016
(2000 =100)
|
Gainers |
Year-on-Year Growth (%) |
|
|---|---|---|
|
June 2016
(revised) |
May 2016
(revised) |
|
|
Basic metals |
47.3 |
25.0 |
|
Machinery except electrical |
18.4 |
26.0 |
|
Beverages |
24.1 |
22.3 |
|
Non-metallic mineral products |
19.0 |
-2.5 |
|
Chemical products |
5.2 |
5.0 |
|
Paper and paper products |
18.5 |
9.5 |
|
Wood and wood products |
37.8 |
64.0 |
|
Rubber and plastic products |
15.8 |
11.8 |
|
Tobacco products |
4.4 |
3.4 |
|
Leather products |
9.9 |
29.3 |
|
Miscellaneous manufactures |
1.1 |
18.8 |
|
Furniture and fixtures |
2.6 |
-11.9 |
|
Losers |
Year-on-Year Growth (%) |
|
|---|---|---|
|
June 2016
(revised) |
May 2016
(revised) |
|
|
Petroleum products |
-12.2 |
-16.8 |
|
Electrical machinery |
-2.9 |
1.9 |
|
Textiles |
-27.7 |
-26.9 |
|
Footwear and wearing apparel |
-14.1 |
-22.3 |
|
Fabricated metal products |
-22.6 |
-2.8 |
|
Food manufacturing |
-1.7 |
4.1 |
|
Printing |
-8.0 |
-3.1 |
|
Transport equipment |
2/ |
-7.6 |
TABLE 2-B Volume of Net Sales Index, May 2016 and June 2016
(2000 = 100)
|
Gainers |
Year-on-Year Growth (%) |
|
|---|---|---|
| June 2016 |
May 2016
(revised) |
|
|
Machinery except electrical |
40.0 |
54.5 |
|
Basic metals |
64.1 |
42.6 |
|
Beverages |
18.8 |
17.1 |
|
Chemical products |
6.1 |
5.4 |
|
Non-metallic mineral products |
16.6 |
-4.4 |
|
Paper and paper products |
16.4 |
7.7 |
|
Rubber and plastic products |
21.6 |
17.4 |
|
Wood and wood products |
39.3 |
65.5 |
|
Furniture and fixtures |
21.3 |
3.6 |
|
Tobacco products |
4.4 |
3.4 |
|
Leather products |
13.2 |
38.3 |
|
Losers |
Year-on-Year Growth (%) |
|
|---|---|---|
| June 2016 |
May 2016
(revised) |
|
|
Food manufacturing |
-3.0 |
2.5 |
|
Textiles |
-28.3 |
-27.7 |
|
Electrical machinery |
-2.4 |
3.0 |
|
Footwear and wearing apparel |
-11.4 |
-17.2 |
|
Fabricated metal products |
-23.7 |
-4.1 |
|
Petroleum products |
-1.6 |
-3.7 |
|
Miscellaneous manufactures |
-4.8 |
11.7 |
|
Printing |
-7.4 |
-2.8 |
|
Transport equipment |
-1.2 |
-7.4 |