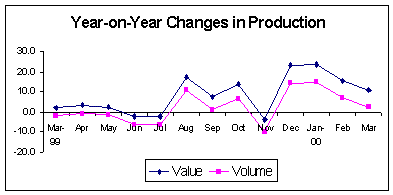
- Manufacturing Output Still Up But Slower
Manufacturing production, as measured by the value of production index (VaPI) and volume of production index (VoPI), went up by 11.0 percent and 2.6 percent, respectively, in March 2000 according to the preliminary results of the Monthly Integrated Survey of Selected Industries (MISSI). However these were slowdowns as were seen also in February in contrast to the significant pick-ups in December and January . Moreover prior to March, the trend of production appeared to be moving since July 1999 in a cycle of one month decline followed by three months growth.
The top gainer in terms of value of production (VaPI) was petroleum refineries, while electrical machinery registered the highest year-on-year increase in terms of volume of production (VoPI).
- Net Sales Move On
Net sales also increased in March, with both value and volume growing by 21.5 percent and 8.2 percent, respectively. The movement of net sales has been generally positive since August 1999 in response to increasing demand and the above cycle of production the past half-year.
Petroleum products had the highest growth in value and volume of net sales.
- Capacity Utilization Higher at 83.7 %
Average capacity utilization in March 2000 for manufacturing was estimated at 83.7 percent, up by 2.2 percentage points from 81.5 percent last year. Twelve out of 16 sectors improved their use of capacity as compared to the same month last year. Electrical machinery registered the highest capacity utilization rate while basic metals posted the lowest rate.
Value of Production
In March 2000, the VaPI of 555.0 increased by 11.0 percent from 499.9 in March 1999. Year-on-year increases were observed in 12 out of 16 major sectors (See Annex 1-A). Topping the gainers in terms of value were petroleum refineries, expanding by 41.9 percent. Other sectors that posted double-digit increases were electrical machinery (32.1%), tobacco (16.1%), other manufacturing industries (14.3%), paper and paper products (14.1%), and rubber products (10.0%).
Basic metals, which continuously recorded declines since August 1998, had the highest year-on-year decline of 26.0 percent in the VaPI. Other sectors which exhibited year-on-year decreases were textile(-24.2%), food manufacturing (-20.3%), and transport equipment (-5.8%).

Volume of Production
The volume of production index (VoPI) for total manufacturing increased by 2.6 percent to 148.8 from 145.0 in March 1999. Ten out of 16 sectors posted year-on year increases led by electrical machinery which increased by 31.3 percent (See Annex 1-B). Other sectors which contributed to the positive performance were other manufacturing industries (25.7%), tobacco (16.3%), paper & paper products (15.7%), rubber products (10.6%), wearing apparel (6.3%), beverage (3.5%), furniture & fixtures (3.2%), chemicals (2.3%) and wood & wood products (0.9%).
On the other hand, six sectors decreased led by textile which went down by 34.0 percent. Other sectors that had declines were basic metals (-30.9%), food manufacturing (-17.5%), transport equipment (-11.8%), non-metallic mineral products (-7.3%) and petroleum products (-5.7%). Decreases in these sectors can be generally attributed to low demand, lack of raw materials and strikes which resulted to closure of some plants and partial shutdown of machinery.
Value of Net Sales
The value of net sales for March 2000 increased by 21.5 percent compared to last year. Twelve out of 16 sectors posted increases led by petroleum products which posted a year-on-year growth of 82.3 percent (See Annex 2-A). Other sectors that recorded double-digit increases were wearing apparel (26.1%), furniture & fixtures (22.1%), other manufacturing (20.5%), electrical machinery (16.5%), paper & paper products (15.3%), and chemicals (14.0%).
On the other hand, wood & wood products registered the biggest decline of 12.0 percent. Other sectors which declined were textile (-7.2%), non-metallic mineral products (-4.0%) and food manufacturing (-1.8%).

Volume of Net Sales
The volume of net sales for March 2000 posted an increase of 8.2 percent over that of last year. Increases were observed in 12 out of 16 sectors led by other manufacturing which increased by 32.5 percent (See Annex 2-B). Other sectors that exhibited double-digit year-on-year growths were wearing apparel (26.5%), furniture & fixtures (22.1%), petroleum products (21.1%), paper & paper products (17.0%), and electrical machinery (15.8%).
On the other hand, four sectors declined led by textile with a 19.3 percent decrease. Other sectors that exhibited decreases were wood & wood products (-12.0%), non-metallic mineral products (-3.4%) and basic metals (-0.5%).
Capacity Utilization
About 21.9 percent of responding establishments operated at full capacity (90%-100%) compared to 16.0 percent in March 1999. Those operating below 70% capacity were 38.5 percent in March 2000 compared to 39.2 percent a year ago.
The March 2000 average capacity utilization rate for manufacturing was estimated at 83.7 percent, which was higher by 2.2 percentage points to 81.5 percent posted last year. Of the 16 major sectors, twelve sectors posted higher capacity utilization rates as compared to a year ago. Electrical machinery recorded the highest capacity utilization rate at 92.8 percent. Other sectors with more than 80 percent capacity utilization were wearing apparel (81.0%), furniture & fixtures (84.0%), chemicals (84.1%), non-metallic mineral products (84.7%), wood & wood products (85.0%), transport equipment (86.0%), rubber products (87.0%), petroleum products (87.0%), paper & paper products (89.0%), other manufacturing (89.0%) and tobacco (90.0%).
Response Rate
These results were based on the response of 328 sample establishments, which comprised 62.8 percent of the total number of establishments covered by the survey.


Source: National Statistics Office
Manila, Philippines
