
|
Table A Year-on-Year Growth Rates for Production Index, Net Sales Index
and Producer Price Index: March 2015 and March 2014
|
||
|---|---|---|
|
TOTAL MANUFACTURING |
March
2015
|
March
2014
|
|
YEAR-ON-YEAR GROWTH |
|
|
|
Production Index (2000=100) |
|
|
|
Value (VaPI) |
7.4 |
0.03 |
|
Volume (VoPI) |
13.6 |
-0.02 |
|
Net Sales Index (2000=100) |
|
|
|
Value (VaNSI) |
1.2 |
4.9 |
|
Volume (VoNSI) |
7.0 |
4.9 |
|
Producer Price Index (2000=100) |
-5.4r |
0.1 |
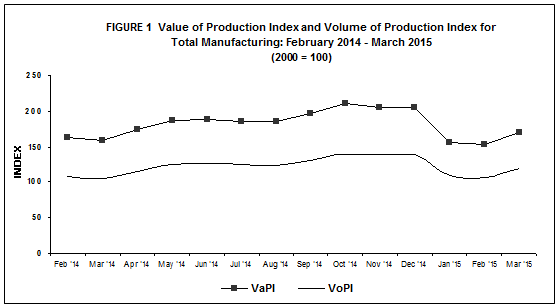
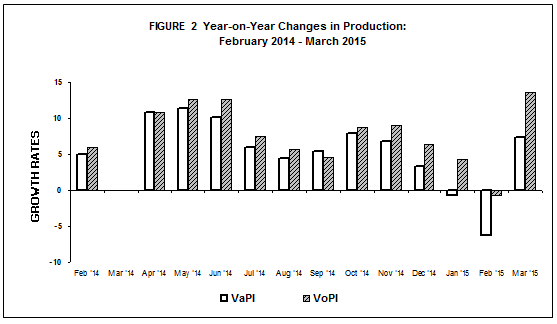
- Value of Production Index rebounds in March 2015
Value of Production Index (VaPI) for total manufacturing reflected a year-on-year increment of 7.4 percent in March 2015, showing an improvement from the 0.03 percent registered during the same period of last year, according to the preliminary results of the Monthly Integrated Survey of Selected Industries (MISSI). Nine sectors that mainly influenced the increases in VaPI are as follows: tobacco products (84.7%), basic metals (63.0%), petroleum products (60.0%), textiles (31.6%), chemical products (29.5%), beverages (18.9%), printing (17.5%), rubber and plastic products (15.0%), and leather products (11.3%). Refer to Tables 1-A and 1.
- Volume of Production Index exhibits a two-digit growth in March 2015
Volume of Production Index (VoPI) gained further as it posted a two-digit increase of 13.6 percent in March 2015. Significant increases in VoPI were noted in eight of the 14 major sectors that registered growth, namely: petroleum products (95.9%), basic metals (73.9%), tobacco products (72.4%), chemical products (63.5%), textiles (30.1%), printing (17.5%), beverages (12.4%), and leather products (11.3%). Refer to Tables 1-B and 2.
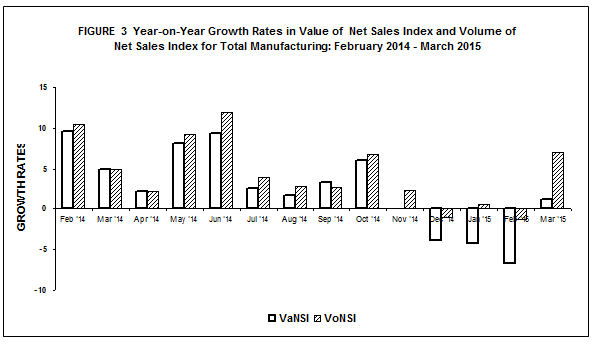
- Value of Net Sales Index also increases in March 2015
Value of Net Sales Index (VaNSI) modestly grew to 1.2 percent in March 2015. Six major sectors that largely contributed to the expansion in VaNSI were: basic metals (53.9%), leather products (41.1%), tobacco products (34.4%), chemical products (31.4%), transport equipment (23.6%), and textiles (10.5%). Refer to Tables 2-A and 3.
- Volume of Net Sales Index picks up in March 2015
Volume of Net Sales Index (VoNSI) grew by 7.0 percent in March 2015 compared with 4.9 percent increase during the same month of last year. The increment was mainly due to the improved performance of VoNSI observed in 11 major sectors, with two-digit increases reported by the following: chemical products (65.9%), basic metals (64.2%), leather products (41.1%), furniture and fixtures (26.4%), transport equipment (26.2%), tobacco products (25.5%), and non-metallic mineral products (10.9%). Refer to Tables 2-B and 4.
- Capacity Utilization in March 2015 is 83.5 percent
Average capacity utilization in March 2015 for total manufacturing was recorded at 83.5 percent. Fifty percent or 10 of the 20 major industries operated at 80 percent and above capacity utilization rates. These are:
- basic metals (88.7%)
- petroleum products (88.5%)
- non-metallic mineral products (86.2%)
- machinery except electrical (84.9%)
- electrical machinery (84.6%)
- food manufacturing (84.5%)
- chemical products (83.4%)
- paper and paper products (83.0%)
- rubber and plastic products (82.6%)
- printing (80.0%)
The proportion of establishments that operated at full capacity (90% to 100%) was 26.3 percent in March 2015. About 55.5 percent of the establishments operated at 70% to 89% capacity while 18.2 percent of the establishments operated below 70% capacity. Refer to Table 6 and B.
|
Table B Distribution of Key Manufacturing Establishments by Capacity Utilization for Total Manufacturing: March 2015 |
|
|---|---|
|
Capacity Utilization |
Percent Share |
|
Below 50% |
3.7 |
|
50% - 59% |
3.9 |
|
60% - 69% |
10.6 |
|
70% - 79% |
20.4 |
|
80% - 89% |
35.1 |
|
90% - 100% |
26.3 |
- Industry Coverage
The 2015 MISSI utilizes the 2009 Philippine Standard Industrial Classification (PSIC) to classify major industries and sub-industries. Twenty major industries of the 2009 PSIC were formed to comprise the industry coverage of the 2015 MISSI. These are presented in the table below.
|
2009 PSIC CODE |
INDUSTRY DESCRIPTION |
|---|---|
|
C10 |
Food manufacturing * |
|
C11 |
Beverages |
|
C12 |
Tobacco products |
|
C13 |
Textiles* |
|
C14, C152 |
Footwear and wearing apparel |
|
C151 |
Leather products |
|
C16 |
Wood and wood products* |
|
C17 |
Paper and paper products |
|
C18 |
Printing |
|
C19 |
Petroleum products* |
|
C20,C21 |
Chemical products* |
|
C22 |
Rubber and plastic products* |
|
C23 |
Non-metallic mineral products* |
|
C24 |
Basic metals* |
|
C25,C3311 |
Fabricated metal products |
|
C262,C275,C28, C263,C268,C3312,C332 |
Machinery except electrical* |
|
C261,C264,C27, C29301,C3314,C332 |
Electrical machinery* |
|
C29 except C29301, C30,C3315 |
Transport equipment |
|
C31 |
Furniture and fixtures |
|
C265,C266,C267,C32, C3313,C3319 |
Miscellaneous manufactures |
|
Note: * - Major industries categorized into sub-industries |
|
- Response Rate
The response rates for the March 2015 MISSI and PPS are 79.6 percent and 85.4 percent, respectively. Refer to Tables 7 and 8.
|
Table C Response Rates For Total Manufacturing
(In percent)
|
||
|---|---|---|
|
|
March 2015 |
February 2015
(Revised)
|
|
MISSI |
79.6 |
91.6r |
|
PPS |
85.4 |
96.2r |
Data of non-responding samples were estimated using short term relative of responding samples within the industry class. Revisions to the preliminary estimates are done upon receipt of actual reports of late respondents.
TABLE 1-A Value of Production Index, February 2015– March 2015
(2000 =100)
|
Gainers |
Year-on-Year Growth (%) |
|
|---|---|---|
|
March 2015 |
February 2015
(revised)
|
|
|
Petroleum products |
60.0 |
-30.8 |
|
Basic metals |
63.0 |
36.8 |
|
Chemical products |
29.5 |
-17.5 |
|
Tobacco products |
84.7 |
78.6 |
|
Beverages |
18.9 |
46.2 |
|
Textiles |
31.6 |
32.5 |
|
Rubber and plastic products |
15.0 |
-17.0 |
|
Printing |
17.5 |
51.4 |
|
Transport equipment |
2.8 |
-4.4 |
|
Paper and paper products |
2.5 |
26.1 |
|
Leather products |
11.3 |
6.6 |
|
Non-metallic mineral products |
0.4 |
14.8 |
|
Losers |
Year-on-Year Growth (%) |
|
|---|---|---|
| March 2015 |
February 2015
(revised)
|
|
|
Food manufacturing |
-10.4 |
-18.2 |
|
Electrical machinery |
-5.4 |
-5.3 |
|
Footwear and wearing apparel |
-18.8 |
-18.6 |
|
Machinery except electrical |
-3.9 |
1.6 |
|
Furniture and fixtures |
-19.1 |
-51.4 |
|
Wood and wood products |
-18.7 |
4.5 |
|
Miscellaneous manufactures |
-4.1 |
-7.4 |
|
Fabricated metal products |
-2.6 |
-4.8 |
TABLE 1-B Volume of Production Index, February 2015– March 2015
(2000 = 100)
|
Gainers |
Year-on-Year Growth (%) |
|
|---|---|---|
| March 2015 |
February 2015
(revised)
|
|
|
Petroleum products |
95.9 |
-5.5 |
|
Chemical products |
63.5 |
2.4 |
|
Basic metals |
73.9 |
46.6 |
|
Tobacco products |
72.4 |
66.5 |
|
Electrical machinery |
6.0 |
5.7 |
|
Beverages |
12.4 |
38.2 |
|
Textiles |
30.1 |
31.0 |
|
Rubber and plastic products |
8.9 |
-22.3 |
|
Transport equipment |
4.9 |
-3.1 |
|
Printing |
17.5 |
51.4 |
|
Non-metallic mineral products |
6.8 |
21.1 |
|
Paper and paper products |
2.0 |
25.8 |
|
Leather products |
11.3 |
6.6 |
|
Furniture and fixtures |
1.0 |
-40.5 |
|
Losers |
Year-on-Year Growth (%) |
|
|---|---|---|
| March 2015 |
February 2015
(revised)
|
|
|
Food manufacturing |
-11.7 |
-19.8 |
|
Footwear and wearing apparel |
-18.0 |
-18.1 |
|
Machinery except electrical |
-4.2 |
1.9 |
|
Wood and wood products |
-9.1 |
16.3 |
|
Miscellaneous manufactures |
-1.8 |
-6.4 |
|
Fabricated metal products |
-0.5 |
-2.1 |
TABLE 2-A Value of Net Sales Index, February 2015– March 2015
(2000 =100)
|
Gainers |
Year-on-Year Growth (%) |
|
|---|---|---|
| March 2015 |
February 2015
(revised)
|
|
|
Chemical products |
31.4 |
-1.6 |
|
Basic metals |
53.9 |
29.4 |
|
Transport equipment |
23.6 |
29.4 |
|
Machinery except electrical |
7.7 |
-0.9 |
|
Tobacco products |
34.4 |
2.9 |
|
Textiles |
10.5 |
0.2 |
|
Non-metallic mineral products |
4.3 |
3.3 |
|
Leather products |
41.1 |
-12.6 |
|
Paper and paper products |
3.2 |
7.9 |
|
Rubber and plastic products |
5.1 |
6.6 |
|
Furniture and fixtures |
1.2 |
-3.2 |
|
Losers |
Year-on-Year Growth (%) |
|
|---|---|---|
| March 2015 |
February 2015
(revised)
|
|
|
Petroleum products |
-24.2 |
-25.7 |
|
Electrical machinery |
-12.4 |
-8.5 |
|
Beverages |
-23.2 |
-11.6 |
|
Footwear and wearing apparel |
-16.7 |
-22.7 |
|
Miscellaneous manufactures |
-14.5 |
-11.0 |
|
Food manufacturing |
-1.5 |
-15.2 |
|
Printing |
-21.4 |
-29.9 |
|
Fabricated metal products |
-4.6 |
15.3 |
|
Wood and wood products |
-2.7 |
-12.7 |
TABLE 2-B Volume of Net Sales Index, February 2015– March 2015
(2000 = 100)
|
Gainers |
Year-on-Year Growth (%) |
|
|---|---|---|
|
March 2015 |
February 2015
(revised)
|
|
|
Chemical products |
65.9 |
22.1 |
|
Basic metals |
64.2 |
38.6 |
|
Transport equipment |
26.2 |
31.1 |
|
Machinery except electrical |
7.3 |
-0.6 |
|
Tobacco products |
25.5 |
-4.1 |
|
Non-metallic mineral products |
10.9 |
9.1 |
|
Furniture and fixtures |
26.4 |
18.6 |
|
Textiles |
9.2 |
-0.9 |
|
Leather products |
41.1 |
-12.5 |
|
Paper and paper products |
2.8 |
7.6 |
|
Wood and wood products |
8.7 |
-2.9 |
|
Losers |
Year-on-Year Growth (%) |
|
|---|---|---|
| March 2015 |
February 2015
(revised)
|
|
|
Beverages |
-27.4 |
-16.4 |
|
Petroleum products |
-7.3 |
1.4 |
|
Food manufacturing |
-2.9 |
-16.8 |
|
Footwear and wearing apparel |
-15.8 |
-22.1 |
|
Electrical machinery |
-1.8 |
2.1 |
|
Miscellaneous manufactures |
-12.6 |
-10.2 |
|
Printing |
-21.4 |
-29.9 |
|
Fabricated metal products |
-2.6 |
18.6 |
|
Rubber and plastic products |
-0.5 |
-0.2 |