
| Total Manufacturing | May 2005 | April 2005 |
| Year-on-Year Growth | ||
| Production Index | ||
| Value(VaPI) | 12.9 | 14.2r |
| Volume(VoPI) | 5.4 | 3.1r |
| Net Sales Index | ||
| Value | 10.5 | 15.3r |
| Volume | 1.0 | 2.9r |
| Producer's Price Index | 7.2 | 10.8r |
| Average Capacity Utilization | 80.1 | 80.0 |
r -revised
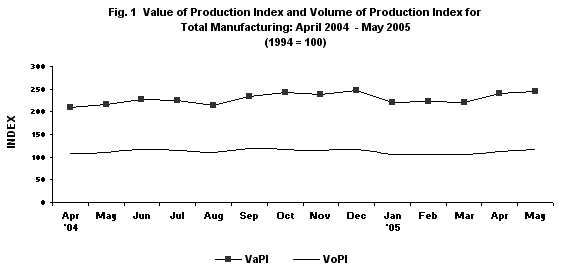
- Value of Production Index maintains uptrend
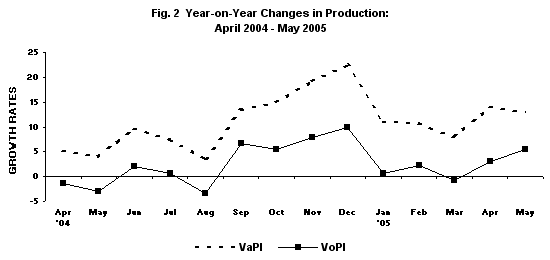
Value of Production Index (VaPI) for the manufacturing industry on a year-on-year basis continued to gain by 12.9 percent in May 2005, according to the preliminary results of the Monthly Integrated Survey of Selected Industries (MISSI). This was brought about by the double-digit increases of nine (9) major sectors, as follows: petroleum products, publishing and printing, furniture and fixtures, transport equipment, basic metals, tobacco, textile, chemical products and non-metallic mineral products.Refer to Tables 1-A and 1.
Meanwhile, VaPI on a monthly basis continued to increase at slower rate by 1.8 percent in May 2005. The notable growth of the two (2) major sectors, machinery excluding electrical and tobacco attributed to the positive increase, followed by basic metals, leather products, petroleum products and wood and wood products.Refer to Tables 1-A and 1.
- Volume of Production Index (VoPI) picks up
Volume of Production Index (VoPI) on a year-on-year basis gained by 5.4 percent in May 2005. The six (6) major sectors that reported significant increases in output were the following: furniture and fixtures, transport equipment, publishing and printing, textile, petroleum products and basic metals. Refer to Tables 2 and 1-B.
On a month-on-month basis, VoPI in May 2005 continued to grow by 3.6 percent. Sectors with double digit increases were machinery excluding electrical, tobacco, basic metals, leather products, petroleum products and wood and wood products. Refer to Tables 2 and 1-B.
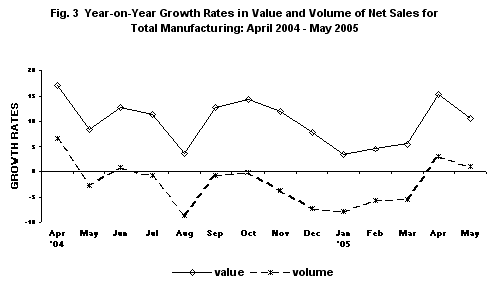
- Value of Net Sales still increases
Value of Net Sales in May 2005 continued to rise by 10.5 percent compared to a year ago figure. Major sectors that significantly posted double-digit increases were the following: non-metallic mineral products, transport equipment, petroleum products, basic metals, furniture and fixtures, paper and paper products, publishing and printing, beverage and textile. Refer to Tables 2-A and 3.
On the other hand, Value of Net Sales on a month-on-month basis dropped by 0.9 percent compared to the previous month. Sectors that contributed to the decrease were furniture and fixtures, electrical machinery, rubber products, chemical products, food manufacturing and publishing and printing.Refer to Tables 2-A and 3.
- Volume of Net Sales continues to gain
Volume of Net Sales on a year-on-year basis increased by 1.0 percent in May 2005. Sectors that reported significant demand of its products were transport equipment, non-metallic mineral products, furniture and fixtures, paper and paper products, beverage and basic metals.Refer to Tables 2-B and 4.
Likewise, Volume of Net Sales on a monthly basis registered a positive growth of 0.1 percent. Wood and wood products, leather products, fabricated metal products and machinery excluding electrical sectors reported increases in sales.Refer to Tables 2-B and 4.
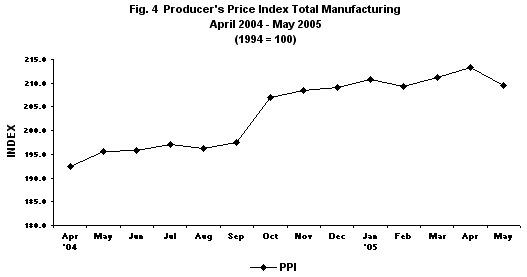
Producer's Price Index (PPI) rises
In May 2005, Producer's Price Index (PPI) for total manufacturing rose by 7.2 percent compared to a year ago figure. Major sectors that showed significant increases in the PPI were petroleum products, tobacco, basic metals, chemical products, machinery excluding electrical, and publishing and printing. Refer to Table 5..
However, PPI on a month-on-month basis fell by 1.8 percent in May 2005. Nine (9) major sectors reported drops in the PPI, led by fabricated metal products and electrical machinery. Refer to Table 5.
- Capacity Utilization
Average capacity utilization in May 2005 for total manufacturing was estimated at 80.1 percent. Major sectors with more than 80% capacity utilization rates were the following: machinery excluding electrical, electrical machinery, petroleum products, paper and paper products, miscellaneous manufacture, basic metals, rubber products, leather products, food manufacturing and chemical products.Refer to Table 6..
In May 2005, the proportion of establishments that operated at full capacity (90%-100%) was 14.4 percent. More than half or 53.1 percent of the establishments operated at 70%-89% capacity and 32.5 percent of the establishments operated below 70% capacity.
Distribution of Key Manufacturing Establishments by Capacity Utilization
Total Manufacturing, MAY 2005
(In percent)Capacity Utilization Percent Share Below 50 percent 5.5 50 percent - 59 percent 8.8 60 percent - 69 percent 18.2 70 percent - 79 percent 21.1 80 percent - 89 percent 32.0 90 percent - 100 percent 14.4 - Response Rate
The response rate for May 2005 is 88.5 percent, which corresponds to the retrieval of 461 sample establishments' reports.Refer to Table 7.
Response Rates for Total Manufacturing
(In percent)May 2005 April 2005
(revised)88.5 94.2 - Technical Notes
Starting 2004, weights for the Producer's Price Index (PPI) are based from the results of the 2000 Census of Philippine Business and Industry (CPBI) for establishments with average total employment (ATE) of 20 and over. Reference year for the 2000 CPBI is 1999. Refer to Press Release on Revision of 2004 PPI weights..
Data of non-responding sample establishments are estimated based on previous records and other available sources. Revisions to the preliminary estimates are done upon receipt of actual reports of late respondents.
(Sgd.) CARMELITA N. ERICTA
AdministratorTABLE 1-A. VALUE OF PRODUCTION INDEX, April 2005 - May 2005
(1994 =100)Gainers Year-on-Year Growth (percent) May 2005 April 2005
(revised)Petroleum Products
46.5
36.0
Transport Equipment
29.0
68.5
Basic Metals
27.7
1.2
Chemical Products
14.3
23.2
Tobacco
23.1
-3.2
Textile
20.5
13.5
Electrical Machinery
4.6
5.9
Non-Metallic Mineral Products
14.0
30.4
Publishing and Printing*
38.3
18.0
Furniture and Fixtures
31.0
63.7
Food Manufacturing
0.8
10.9
Paper and Paper Products
5.9
7.9
Miscellaneous Manufacture
8.8
21.3
Rubber Products
5.8
13.1
Losers Year-on-Year Growth (percent) May 2005 April 2005
(revised)Machinery Excluding Electrical*
-40.1
-57.3
Wood and Wood Products
-37.5
-42.9
Footwear and Wearing Apparel*
-4.1
-3.5
Fabricated Metal Products*
-8.1
7.8
Leather Products*
-36.0
-17.3
Beverage
-0.9
13.1
TABLE 1-A. VALUE OF PRODUCTION INDEX, April 2005 - May 2005
(concluded)
(1994=100)Gainers Month-on-Month Growth (percent) May 2005 April 2005
(revised)Petroleum Products
17.8
26.0
Tobacco
51.1
57.7
Basic Metals
24.4
-5.2
Machinery Excluding Electrical*
52.5
-48.3
Textile
8.2
-2.6
Footwear and Wearing Apparel*
5.3
-19.8
Wood and Wood Products
14.0
5.1
Publishing and Printing*
9.7
37.0
Transport Equipment
1.5
-7.0
Leather Products*
20.4
-32.5
Non-Metallic Mineral Products
0.4
7.8
Rubber Products
1.3
0.5
Paper and Paper Products
0.4
3.1
Losers Month-on-Month Growth (percent) May 2005 April 2005
(revised)Electrical Machinery
-11.2
14.9
Chemical Products
-6.1
11.4
Food Manufacturing
-3.5
4.1
Beverage
-10.6
12.0
Fabricated Metal Products*
-5.3
16.7
Miscellaneous Manufacture
-3.9
6.0
Furniture and Fixtures
-5.7
-49.6
Note: * - new sectors in the 1994-based seriesSectors are ranked according to their contribution to the overall 1994-based May 2005 growth rate.
Year-on-year growth rates are computed by dividing the current month index by previous year same month index less 1.
Month-on-month growth rates are computed by dividing the current month index by previous month index less 1.
TABLE 1-B. VOLUME OF PRODUCTION INDEX, April 2005 - May 2005
(1994 = 100)Gainers Year-on-Year Growth (percent) May 2005 April 2005
(revised)Petroleum Products
13.0
-0.1
Transport Equipment
25.3
61.7
Basic Metals
10.1
-14.4
Textile
19.0
13.9
Electrical Machinery
4.6
-2.9
Publishing and Printing*
22.5
4.6
Furniture and Fixtures
33.5
65.8
Non-Metallic Mineral Products
5.0
20.4
Paper and Paper Products
3.0
2.1
Miscellaneous Manufacture
4.2
16.0
Rubber Products
5.9
13.5
Chemical Products
0.2
4.2
Losers Year-on-Year Growth (percent) May 2005 April 2005
(revised)Food Manufacturing
-4.6
4.1
Machinery Excluding Electrical*
-47.4
-62.9
Wood and Wood Products
-41.2
-46.2
Fabricated Metal Products*
-8.1
-9.8
Footwear and Wearing Apparel*
-3.2
-0.6
Tobacco
-2.0
-22.9
Leather Products*
-40.6
-23.3
Beverage
-1.0
13.0
TABLE 1-B. VOLUME OF PRODUCTION INDEX, April 2005 - May 2005
(concluded)
(1994=100)Gainers Month-on-Month Growth (percent) May 2005 April 2005
(revised)Petroleum Products
18.2
22.7
Tobacco
51.1
57.7
Basic Metals
24.7
-7.1
Machinery Excluding Electrical*
54.4
-49.9
Textile
8.2
-3.4
Transport Equipment
3.1
-8.0
Footwear and Wearing Apparel*
3.8
-16.1
Wood and Wood Products
13.3
5.1
Fabricated Metal Products*
7.7
16.7
Publishing and Printing*
9.7
37.0
Leather Products*
20.4
-32.5
Paper and Paper Products
1.3
0.5
Non-Metallic Mineral Products
0.4
8.2
Rubber Products
1.2
0.5
Losers Month-on-Month Growth (percent) May 2005 April 2005
(revised)Electrical Machinery
-6.1
15.6
Chemical Products
-5.9
8.5
Food Manufacturing
-3.6
3.7
Beverage
-10.6
10.9
Miscellaneous Manufacture
-4.0
2.7
Furniture and Fixtures
-5.6
-50.1
Note: * - new sectors in the 1994-based seriesSectors are ranked according to their contribution to the overall 1994-based May 2005 growth rate.
Year-on-year growth rates are computed by dividing the current month index by previous year same month index less 1.
Month-on-month growth rates are computed by dividing the current month index by previous month index less 1.
TABLE 2-A. VALUE OF NET SALES, April 2005 - May 2005
(1994=100)Gainers Year-on-Year Growth (percent) May 2005 April 2005
(revised)Petroleum Products
30.1
30.8
Transport Equipment
50.0
59.4
Non-Metallic Mineral Products
53.9
29.7
Basic Metals
27.8
29.9
Chemical Products
8.3
14.8
Beverage
11.3
11.8
Paper and Paper Products
20.7
26.2
Textile
11.2
14.0
Publishing and Printing*
14.3
19.8
Furniture and Fixtures
24.0
52.3
Fabricated Metal Products*
6.5
4.3
Rubber Products
2.2
5.4
Losers Year-on-Year Growth (percent) May 2005 April 2005
(revised)Food Manufacturing
-3.9
10.5
Electrical Machinery
-5.2
-3.7
Machinery Excluding Electrical*
-37.6
-47.2
Footwear and Wearing Apparel*
-9.9
5.9
Wood and Wood Products
-38.1
-54.1
Tobacco
-11.0
-5.4
Leather Products*
-22.6
-2.9
Miscellaneous Manufacture
-1.8
-7.3
TABLE 2-A. VALUE OF NET SALES, April 2005 - May 2005 (concluded)
(1994=100)Gainers Month-on-Month Growth (percent) May 2005 April 2005
(revised)Wood and Wood Products
35.7
-41.8
Footwear and Wearing Apparel*
6.0
-17.8
Textile
5.2
-3.6
Machinery Excluding Electrical*
10.6
-7.2
Basic Metals
1.9
1.3
Non-Metallic Mineral Products
3.2
15.2
Beverage
1.9
0.1
Miscellaneous Manufacture
5.2
0.1
Transport Equipment
0.9
2.3
Leather Products*
21.6
-40.2
Tobacco
0.8
34.7
Fabricated Metal Products*
1.1
5.7
Paper and Paper Products
0.5
1.4
Losers Month-on-Month Growth (percent) May 2005 April 2005
(revised)Electrical Machinery
-6.9
7.1
Food Manufacturing
-3.5
3.2
Chemical Products
-5.7
14.1
Petroleum Products
-0.8
4.0
Furniture and Fixtures
-7.2
-6.5
Rubber Products
-6.8
0.5
Publishing and Printing*
-1.6
17.4
Note: * - new sectors in the 1994-based seriesSectors are ranked according to their contribution to the overall 1994-based May 2005 growth rate.
Year-on-year growth rates are computed by dividing the current month value of net sales by previous year same month value of net sales less 1.
Month-on-month growth rates are computed by dividing the current month value of net sales by previous month value of net sales less 1.
TABLE 2-B. VOLUME OF NET SALES, April 2005 - May 2005
(1994=100)Gainers Year-on-Year Growth (percent) May 2005 April 2005
(revised)Transport Equipment
45.8
53.0
Non-metallic Mineral Products
41.7
19.7
Basic Metals
10.2
9.8
Beverage
11.2
11.7
Paper and Paper Products
17.4
19.5
Textile
9.8
14.4
Furniture and Fixtures
26.4
54.2
Fabricated Metal Products*
6.5
-12.7
Petroleum Products
0.3
-3.9
Rubber Products
2.3
5.8
Publishing and Printing*
1.2
6.1
Losers Year-on-Year Growth (percent) May 2005 April 2005
(revised)Food Manufacturing
-9.1
3.7
Tobacco
-29.1
-24.7
Electrical Machinery
-5.2
-11.7
Machinery Excluding Electrical*
-45.2
-54.2
Chemical Products
-5.1
-2.9
Wood and Wood Products
-41.8
-56.7
Footwear and Wearing Apparel*
-9.1
9.1
Miscellaneous Manufacture
-5.9
-11.4
Leather Products*
-28.2
-9.9
TABLE 2-B. VOLUME OF NET SALES, April 2005 - May 2005 (concluded)
(1994=100)Gainers Month-on-Month Growth (percent) May 2005 April 2005
(revised)Wood and Wood Products
34.8
-41.8
Fabricated Metal Products*
14.9
5.7
Footwear and Wearing Apparel*
4.5
-14.0
Machinery Excluding Electrical*
12.0
-9.9
Textile
5.2
-4.3
Transport Equipment
2.5
1.3
Basic Metals
2.2
-0.8
Non-metallic Mineral Products
3.1
15.6
Beverage
1.9
-0.9
Miscellaneous Manufactures
5.2
-3.1
Leather Products*
21.6
-40.2
Paper and Paper Products
1.3
-1.2
Tobacco
0.8
34.7
Losers Month-on-Month Growth (percent) May 2005 April 2005
(revised)Food Manufacturing
-3.6
2.5
Chemical Products
-5.4
11.1
Electrical Machinery
-1.5
7.8
Petroleum Products
-0.5
1.4
Rubber Products
-6.9
0.5
Furniture and Fixtures
-7.1
-7.4
Publishing and Printing*
-1.6
17.4
Note: * - new sectors in the 1994-based seriesSectors are ranked according to their contribution to the overall 1994-based May 2005 growth rate.
Year-on-year growth ratesare computed by dividing the current month volume of net sales by previous year same month volume of net sales less 1.
Month-on-month growth rates are computed by dividing the current month volume of net sales by previous month volume of net sales less 1.
Source: National Statistics Office
Manila, Philippines