
Volume of Production and Net Sales
Volumes of production and net sales increased by 4.2 percent and 11.9 percent, respectively compared to the same month last year according to the preliminary results of the Monthly Integrated Survey of Selected Industries (MISSI).
Wood & wood products, tobacco, wearing apparel and electrical machinery posted increases in volume of production and net sales after recording negative growth rates last year. This can be attributed to the resumption of operation of key establishments and increase in demand of the products.
Value of Production and Net Sales
Compared to the same month last year, values of production and net sales increased by 11.2 percent and 20.1 percent, respectively.
Wood & wood products, tobacco, wearing apparel, paper & paper products and food manufacturing which recorded negative growth rates in value of production and net sales last year posted increases in September 1999.
Capacity Utilization
About 48.7 percent of the total responding establishments operated below 70% capacity. Eleven out of 16 sectors showed declines in their capacity utilization in September 1999.
Value of Production
In September 1999, the value of production index (VaPI) of 541.9 increased by 11.2 percent from 487.5 in September 1998. Year-on-year increases were observed in 11 out of 16 major sectors (See Annex 1A). Wood & wood products posted the highest year-on-year VaPI increase of 102.5 percent due to the increase in production of plywood. This can be attributed to the increase in both domestic and export demand for the product. Other sectors that posted double-digit increases were transport equipment (69.7%), furniture & fixtures (21.3%), electrical machinery (15.2%), and tobacco (14.0%). On the other hand, basic metals reported the biggest decline of 44.4 percent. Other sectors that posted decreases were chemicals/plastic & plastic products (-17.9%), textile (-15.2%), non-metallic mineral products (-10.5%), and rubber products (-12.8%). Decreases in these sectors can be attributed to the slowdown in production due to, among others, the continuing low demand for construction-related industries resulting to partial shutdown of machinery, lack of imported raw materials in the chemicals sector.
Volume of Production
The volume of production index (VoPI) increased by 4.2 percent to 149.5 from 143.5 last year. Eight out of 16 sectors posted year-on-year increases led by wood & wood products which increased by 105.9 percent (See Annex 1B). Other sectors which contributed to the increase of the overall VoPI were transport equipment (64.8%), tobacco (16.5%), electrical machinery (15.4%), other manufacturing industries (14.4%), furniture & fixtures (9.8%), food manufacturing (2.9%) and wearing apparel (0.9%).
Value of Net Sales
The value of net sales for September 1999 increased by 20.1 percent compared to last year. Twelve out of 16 sectors posted increases led by wood & wood products which increased by 81.7 percent (Se Annex 2A). Other sectors that recorded increases were petroleum products (41.7%), tobacco (31.1%), electrical machinery (26.2%), wearing apparel (17.4%), transport equipment (16.9%), food manufacturing (14.4%), chemicals (12.4%), textile (11.0%), basic metals (6.9%), miscellaneous manufactures (3.6%) and paper & paper products (3.3%). On the other hand, rubber products posted the biggest decline of 22.9 percent. Other sectors that posted decreases were non-metallic mineral products (-22.0%), beverage (-8.1%) and furniture & fixtures (-6.3%).
Volume of Net Sales
The volume of net sales for September 1999 posted an increase of 11.9 percent over last year. Increases were observed in ten sectors led by wood & wood products, which increased by 84.7 percent (Se Annex 2B). Other sectors that posted increases were tobacco (33.9%), electrical machinery (26.4%), food manufacturing (16.3%), basic metals (15.5%), wearing apparel (14.9%), transport equipment (13.5%), petroleum products (12.6%), miscellaneous manufactures (8.3%) and chemicals (5.7%).
Capacity Utilization
Responding establishments operating below 70% capacity were 48.7 percent in September 1999 compared t 40.0 percent a year ago. About 14.1 percent operated at full capacity (90%-100%) compared to 16.8 percent in September 1998.
The following sectors that had decreased use of existing capacity in September 1999 were beverage, tobacco, textile, wood & wood products, furniture & fixtures, paper & paper products, rubber, chemicals, non-metallic mineral products, basic metals and transport equipment. On the other hand, food, wearing apparel, electrical machinery, petroleum products and miscellaneous manufactures showed indications of increasing capacity utilization. Capacity utilization is defined as the ratio of output to the maximum rated capacity of the plant.
Response Rate
The results are based on the responses of 419 establishments, which comprised 75.8 percent of the total samples in the survey.
| ANNEX 1-A | ||
|
VALUE OF PRODUCTION INDEX (SEPTEMBER 1999) |
||
| YEAR-ON-YEAR | GROWTH (%) | |
| SEPTEMBER | AUGUSTr | |
| GAINERS Wood & Wood Products Transport Equipment Petroleum Refineries Electrical Machinery Food Manufacturing Wearing Apparel Furniture & Fixtures Paper & Paper Products Beverage Other Mfg. Industries Tobacco |
102.5 69.7 9.3 15.2 1.2 3.1 21.3 3.0 3.3 9.4 14.0 |
-27.3 28.4 13.9 62.3 -2.3 -4.0 1.0 -6.2 -10.7 -8.7 -10.1 |
| LOSERS Basic Metals Chemicals/Plastic & Plastic Prods. Textile Non-Metallic Mineral Prods. Rubber Products |
-44.4 -17.9 -15.2 -10.5 -12.8 |
-40.5 -3.9 -20.1 5.6 -12.5 |
| MONTH-ON-MONTH |
||
| GAINERS Food Manufacturing Wood & Wood Products Petroleum Refineries Wearing Apparel Basic Metals Transport Equipment Paper & Paper Products Beverage Textile Furniture & Fixtures Other Mfg. Industries Tobacco |
24.8 120.0 17.8 20.2 12.3 10.8 10.0 12.4 2.5 8.8 7.4 12.2 |
55.3 4.6 2.5 -17.0 -16.2 -14.6 -13.5 -12.2 -12.8 -7.1 -6.6 -5.7 |
| LOSERS Electrical Machinery Chemicals/Plastic & Plastic Prods. Rubber Products Non-Metallic Mineral Prods. |
-20.7 -15.5 -10.6 -2.4 |
-5.5 -16.2 -1.7 -1.3 |
|
r - revised due to updating of data from late responding establishments. Note: Sectors are ranked according to their contribution to the overall SEPTEMBER 1999 growth rate. |
||
| ANNEX 1-B | ||
|
VOLUME OF PRODUCTION INDEX (SEPTEMBER 1999) |
||
| YEAR-ON-YEAR | GROWTH (%) | |
| SEPTEMBER | AUGUSTr | |
| GAINERS Wood & Wood Products Transport Equipment Electrical Machinery Food Manufacturing Other Mfg. Industries Furniture & Fixtures Wearing Apparel Tobacco |
105.9 64.8 15.4 2.9 14.4 9.8 0.9 16.5 |
-26.1 19.8 -0.2 68.7 0.9 10.8 -8.9 -10.4 |
| LOSERS Basic Metals Petroleum Refineries Chemicals/Plastic & Plastic Prods. Textile Non-Metallic Mineral Prods. Paper & Paper Products Rubber Products Beverage |
-40.3 -13.2 -22.8 -29.5 -26.0 -15.1 -26.2 -12.2 |
-33.2 -34.7 -14.2 -28.6 -9.8 -28.6 -13.4 -20.6 |
| MONTH-ON-MONTH |
||
| GAINERS Food Manufacturing Wood & Wood Products Petroleum Refineries Wearing Apparel Basic Metals Transport Equipment Paper & Paper Products Beverage Textile Other Mfg. Industries Tobacco Furniture & Fixtures |
25.2 120.0 13.6 20.3 12.7 9.9 10.1 12.4 3.2 8.1 12.2 1.2 |
-1.4 -13.8 -1.4 -18.1 -19.2 -13.5 -7.1 -2.0 -2.5 2.2 -7.5 4.6 |
| LOSERS Electrical Machinery Chemicals/Plastic & Plastic Prods. Rubber Products Non-Metallic Mineral Prods. |
-24.0 -15.7 -11.0 -4.4 |
55.6 -6.5 -12.2 -5.6 |
|
r - revised due to updating of data from late responding establishments. Note: Sectors are ranked according to their contribution to the overall SEPTEMBER 1999 growth rate. |
||
| ANNEX 2-A | ||
|
NET SALES VALUE (SEPTEMBER 1999) |
||
| YEAR-ON-YEAR | GROWTH (%) | |
| SEPTEMBER | AUGUSTr | |
| GAINERS Petroleum Products Wood & Wood Products Food Manufacturing Electrical Machinery Chemicals Wearing Apparel Transport Equipment Textile Basic Metals Paper & Paper Products Tobacco Miscellaneous Manufactures |
41.7 81.7 14.4 26.2 12.4 17.4 16.9 11.0 6.9 3.3 31.1 3.6 |
15.6 -16.3 -6.9 -7.5 16.6 -3.5 29.4 -22.6 -35.6 -7.8 -17.4 61.0 |
| LOSERS Non-metallic Mineral Products Rubber Products Beverages Furniture & Fixtures |
-22.0 -22.9 -8.1 -6.3 |
80.7 -16.4 -9.7 -4.2 |
| MONTH-ON-MONTH |
||
| GAINERS Electrical Machinery Petroleum Products Wood & Wood Products Textile Basic Metals Wearing Apparel Beverages Rubber Products Chemicals Non-Metallic Mineral Products Miscellaneous Manufactures Paper & Paper Products Tobacco |
53.5 15.0 40.4 19.9 7.7 5.6 14.2 20.1 2.0 3.7 17.1 1.7 20.7 |
1.6 -11.7 -17.4 -4.8 4.2 11.9 -2.3 -38.6 -5.0 -15.6 -7.3 -0.9 -0.4 |
| LOSERS Food Manufacturing Transport Equipment Furniture & Fixtures |
-2.7 -3.7 -12.9 |
7.4 -12.4 4.3 |
|
Note: Sectors are ranked according to their contribution to the overall SEPTEMBER 1999 growth rate. |
||
| ANNEX 2-B | ||
|
NET SALES VOLUME (SEPTEMBER 1999) |
||
| YEAR-ON-YEAR | GROWTH (%) | |
| SEPTEMBER | AUGUST | |
| GAINERS Food Manufacturing Wood & Wood Products Electrical Machinery Petroleum Products Basic Metals Wearing Apparel Transport Equipment Chemicals Tobacco Miscellaneous Manufactures |
16.3 84.7 26.4 12.6 15.5 14.9 13.5 5.7 33.9 8.3 |
-6.1 -14.9 -3.9 -5.2 -28.2 -1.3 20.6 9.7 -15.6 64.5 |
| LOSERS Furniture & Fixtures Textile Beverages Rubber Products Paper & Paper Products Non-Metallic Mineral Products |
-15.2 -7.7 -21.9 -34.7 -14.9 -31.6 |
-6.8 -25.9 -23.6 -29.0 -27.9 56.5 |
| MONTH-ON-MONTH |
||
| GAINERS Electrical Machinery Petroleum Products Wood & Wood Products Textile Basic Metals Wearing Apparel Beverages Rubber Products Chemicals Non-Metallic Mineral Products Miscellaneous Manufactures Paper & Paper Products Tobacco |
47.1 10.8 40.4 20.7 7.3 5.7 14.2 19.6 1.7 3.7 17.9 1.8 20.7 |
1.8 -17.0 -17.4 -5.8 3.2 12.1 -2.3 -38.6 -5.5 -15.6 -7.6 -1.6 -0.4 |
| LOSERS Furniture & Fixtures Transport Equipment Food Manufacturing |
-19.0 -4.4 -2.3 |
4.3 -12.4 7.9 |
|
Note: Sectors are ranked according to their contribution to the overall SEPTEMBER 1999 growth rate. |
||
| Distribution of Key Enterprise by Capacity Utilization (In percent) |
|||||||||||||
|
|
|||||||||||||
| Capacity Utilization |
1998 | 1999 | |||||||||||
| SEP | OCT | NOV | DEC | JAN | FEB | MAR | APR | MAY | JUN | JUL | AUG | SEP | |
|
|
|||||||||||||
|
Below 50 % 50 - 59 % 60 - 69 % 70 - 79 % 80 - 89 % 90 - 100 % |
11.8 11.4 16.8 22.3 20.9 16.8 |
12.3 12.3 17.1 20.2 20.9 17.3 |
13.1 10.5 15.5 21.0 21.8 18.1 |
12.5 12.5 15.9 20.3 23.5 15.4 |
12.3 12.3 15.3 21.9 21.6 16.8 |
13.8 11.6 16.4 22.6 22.0 13.5 |
14.3 10.6 14.3 22.1 22.6 16.0 |
14.4 10.6 17.1 22.6 20.6 14.7 |
12.8 10.8 14.8 22.8 22.5 16.2 |
22.5 9.0 13.3 19.0 21.0 15.3 |
21.6 8.8 13.3 19.9 20.6 15.7 |
23.0 10.1 12.6 22.0 19.3 13.1 |
28.3 8.0 12.4 20.1 17.1 14.1 |
|
|
|||||||||||||
| Percentage Changes in Production and Net Sales of Key Enterprises: September 1998 - September 1999 |
|||||||||||||
|
|
|||||||||||||
| ITEM | SEP | OCT | NOV | DEC | JAN | FEB | MAR | APR | MAY | JUN | JUL | AUG | SEP |
|
Year-on-Year Change |
|||||||||||||
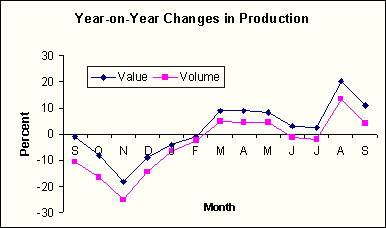
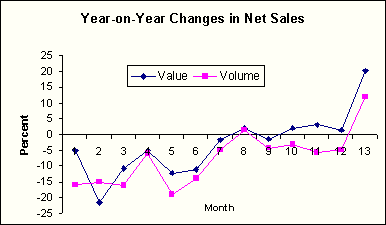
| Production Value Volume Net Sales Value Volume |
-1.2r -10.6r -5.1 -16.0 |
-8.4r -16.5r -21.7 -15.0 |
-18.2r -25.1r -10.7 -16.1 |
-9.0r -14.4r -5.2 -6.0 |
-4.3r -6.4r -12.2 -19.0 |
-0.9r -2.4r -11.1 -13.8 |
8.8r 5.0r -1.7 -4.9 |
8.8r 4.4r 2.1 1.4 |
8.4r 4.4r -1.3 -4.4 |
3.0r -1.4r 2.0 -3.0 |
2.4r -2.2r 3.1 -5.8 |
20.4r 13.5r 1.4 -4.8 |
11.2 4.2 20.1 11.9 |
| Month-on-Month Change |
|||||||||||||
| Production Value Volume Net Sales Value Volume |
5.4r 4.8r 4.1 2.5 |
-5.0r -5.3r 5.6 -1.1 |
-2.4r -3.1r 1.7 0.5 |
-5.8r -4.6r 1.9 1.5 |
4.6r 3.7r -2.7 -10.2 |
7.7r 7.0r 31.3 33.9 |
11.2r 10.9r 8.0 2.9 |
-12.0r -13.0r -6.6 -3.9 |
4.8r 4.5r 7.0 6.4 |
4.3r 3.2r 3.7 0.6 |
-4.1r -4.3r 2.5 -0.3 |
13.1r 11.9r -2.8 -3.9 |
-2.7 -3.7 12.6 11.1 |
|
r - revised due to updating of data from late responding establishments. |
|||||||||||||
Source: National Statistics Office
Manila, Philippines