
|
Table A Year-on-Year Growth Rates for Production Index, Net Sales Index and Producer Price Index: September 2013 and August 2013 |
||
|---|---|---|
|
TOTAL MANUFACTURING |
SEPTEMBER
2013
|
AUGUST
2013
|
|
YEAR-ON-YEAR GROWTH |
|
|
|
Production Index (2000=100) |
|
|
|
Value (VaPI) |
8.6 |
8.8r |
|
Volume (VoPI) |
16.3 |
16.0r |
|
Net Sales Index (2000=100) |
|
|
|
Value (VaNSI) |
21.3 |
21.7r |
|
Volume (VoNSI) |
29.9 |
29.7r |
|
Producer Price Index (2000=100)
|
-6.4r
|
-6.1r
|
- Value of Production Index grows in September 2013
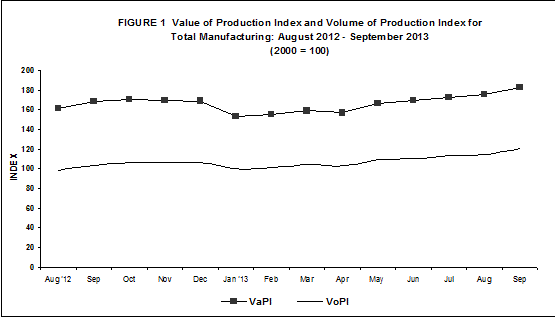
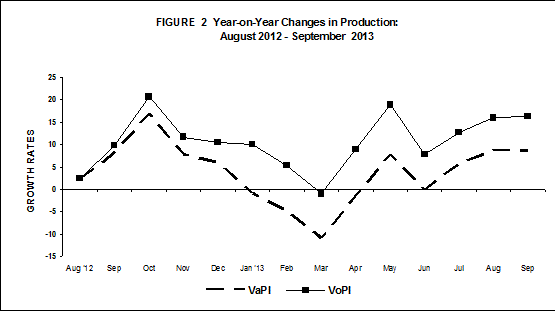
Value of Production Index (VaPI) for the manufacturing reflected an annual increment of 8.6 percent in September 2013, according to the preliminary results of the Monthly Integrated Survey of Selected Industries (MISSI). This was accounted for by the consistent three-digit growth in VaPI for chemical products (156.2%) and two-digit growth in five major sectors. These sectors are furniture and fixtures (50.2%), leather products (44.5%), tobacco products (25.0%), publishing and printing (21.4%), and wood and wood products (17.8%). Refer to Tables 1-A and 1.
On a monthly basis, VaPI further increased by 4.0 percent in September 2013 from 1.8 percent growth in August 2013. Twelve major sectors exhibited increases in VaPI, with two-digit growth in the following: leather products (34.7%), machinery except electrical (27.9%), miscellaneous manufactures (14.9%), and chemical products (12.0%). Refer to Tables 1-A and 1.
- Volume of Production sustains its two-digit growth
Volume of Production Index (VoPI) shows a two-digit annual growth of 16.3 percent in September 2013. The two major sectors that mainly influenced the increase in VoPI were chemical products and furniture and fixtures, registering growth of 173.3 percent and 167.9 percent, respectively. Other major sectors that contributed to the growth with two-digit increases were leather products (43.0%), tobacco products (34.4%), basic metals (21.8%), wood and wood products (13.3%), publishing and printing (11.4%), and rubber and plastic products (10.1%). Refer to Tables 1-B and 2.
On a month-on-month comparison, VoPI moved up increasingly to a growth of 5.3 percent in September 2013. Five major sectors exhibited two-digit increases in VoPI, namely: leather products (35.0%), machinery except electrical (31.4%), miscellaneous manufactures (16.7%), chemical products (13.3%), and electrical machinery (11.6%). Refer to Tables 1-B and 2.
- Value of Net Sales post two-digit growth in September 2013
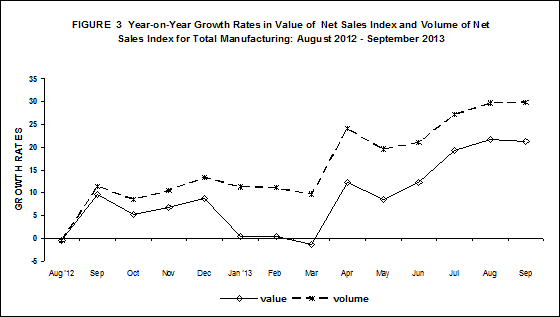
Value of Net Sales Index (VaNSI) maintained a two-digit growth rate registering at 21.3 percent in September 2013. Significant expansion in sales value was notably observed in chemical products with an annual growth of 192.6 percent. This was followed by eight other major sectors that posted two-digit increases, namely: furniture and fixtures (46.4%), machinery except electrical (38.5%), leather products (29.8%), textiles (26.4%), wood and wood products (26.0%), tobacco products (23.6%), basic metals (12.8%), and petroleum products (12.5%). Refer to Tables 2-A and 3.
On a month-on-month change, VaNSI grew 4.5 percent in September 2013. Among the 14 major sectors reporting increases in VaNSI, five major sectors significantly contributed to the increase, namely: publishing and printing (20.7%), leather products (12.7%), textiles (12.2%), chemical products (12.0%), and miscellaneous manufactures (11.8%). Refer to Tables 2-A and 3.
- Volume of Net Sales Index slightly accelerates
Volume of Net Sales Index (VoNSI) continues to gain as it posted an annual growth of 29.9 percent in September 2013. This was due to the growth in 10 out of 12 major sectors that registered increases in VoNSI, with chemical products and furniture and fixtures posted the largest increase of 212.3 percent and 161.2 percent, respectively. This was followed by other eight major sectors that posted two-digit increases, namely: machinery except electrical (54.9%), tobacco products (33.0%), basic metals (31.0%), leather products (28.4%), textiles (24.4%), wood and wood products (21.1%), rubber and plastic products (14.4%), and petroleum products (11.2%). Refer to Tables 2-B and 4.
On a monthly basis, VoNSI also accelerated posting a rate of 5.8 percent in September 2013. The 14 major contributing sectors were led by publishing and printing (20.7%), miscellaneous manufactures (13.5%), chemical products (13.2%), leather products (12.9%), textiles (12.2%), and electrical machinery (10.5%). Refer to Tables 2-B and 4.
- Capacity Utilization in September 2013 is 83.5 percent
Average capacity utilization in September 2013 for total manufacturing was recorded at 83.5 percent. More than 50 percent or eleven of the 20 major sectors registered capacity utilization rates of above 80 percent. These are:
- petroleum products (88.4%)
- basic metals (87.6%)
- non-metallic mineral products (86.1%)
- machinery except electrical (85.3%)
- food manufacturing (84.7%)
- electrical machinery (84.6%)
- chemical products (83.4%)
- paper and paper products (83.3%)
- rubber and plastic products (82.4%)
- wood and wood products (81.4%)
- publishing and printing (81.1%)
The proportion of establishments that operated at full capacity (90% to 100%) was 22.9 percent in September 2013. About 54.5 percent of the establishments operated at 70% to 89% capacity while 22.6 percent of the establishments operated below 70% capacity. Refer to Table 6.
|
Table B Distribution of Key Manufacturing Establishments by Capacity Utilization for Total Manufacturing: September 2013 |
|
|---|---|
|
Capacity Utilization |
Percent Share |
|
Below 50% |
6.0 |
|
50% - 59% |
5.5 |
|
60% - 69% |
11.1 |
|
70% - 79% |
18.3 |
|
80% - 89% |
36.2 |
|
90% - 100% |
22.9 |
- Reponse Rate
The response rates for the September 2013 MISSI and PPS are 80.8 percent and 92.9 percent, respectively. Refer to Tables 7 and 8.
|
Table C Response Rates For Total Manufacturing
(In percent)
|
||
|---|---|---|
|
|
September 2013 |
August 2013
(Revised)
|
|
MISSI
|
80.8
|
92.7r
|
|
PPS
|
92.9r
|
95.2r
|
Data of non-responding samples were estimated based on previous records and other administrative reports of these establishments. Revisions to the preliminary estimates are done upon receipt of actual reports of late respondents.
|
Gainers |
Year-on-Year Growth (%) |
|
|---|---|---|
| September 2013 |
August 2013
(revised)
|
|
|
Chemical products |
156.2 |
133.6 |
|
Tobacco products |
25.0 |
25.4 |
|
Furniture and fixtures |
50.2 |
62.2 |
|
Publishing and printing |
21.4 |
-5.4 |
|
Basic metals |
4.9 |
31.0 |
|
Non-metalli mineral products |
5.3 |
22.4 |
|
Leather products |
44.5 |
30.8 |
|
Wood and wood products |
17.8 |
25.5 |
|
Rubber and plastic products |
1.1 |
-0.6 |
|
Losers |
Year-on-Year Growth (%) |
|
|---|---|---|
| September 2013 |
August 2013
(revised
|
|
|
Petroleum products |
-16.2 |
-0.7 |
|
Transport equipment |
-34.7 |
-41.6 |
|
Machinery except electrical |
-8.8 |
-23.2 |
|
Miscellaneous manufactures |
-34.0 |
-38.0 |
|
Electrical machinery |
-3.7 |
-8.2 |
|
Footwear and wearing apparel |
-22.1 |
-25.4 |
|
Beverages |
-9.7 |
14.8 |
|
Textiles |
-18.2 |
-12.3 |
|
Food manufacturing |
-1.1 |
-3.7 |
|
Paper and paper products |
-8.1 |
-14.6 |
|
Fabricated metal products |
-7.0 |
-18.1 |
|
Gainers |
Month-on-Month Growth (%) |
|
|---|---|---|
| September 2013 |
August 2013
(revised)
|
|
|
Machinery except electrical |
27.9 |
-20.9 |
|
Electrical machinery |
9.6 |
7.4 |
|
Chemical products |
12.0 |
11.2 |
|
Food manufacturing |
3.1 |
2.9 |
|
Miscellaneous manufactures |
14.9 |
-10.9 |
|
Transport equipment |
5.8 |
-18.0 |
|
Footwear and wearing apparel |
6.8 |
-14.2 |
|
Paper and paper products |
5.4 |
-4.3 |
|
Leather products |
34.7 |
-0.4 |
|
Non-metallic mineral products |
2.2 |
-1.2 |
|
Tobacco products |
3.2 |
-1.4 |
|
Fabricated metal products |
1.0 |
-2.9 |
|
Losers |
Month-on-Month Growth (%) |
|
|---|---|---|
| September 2013 |
August 2013
(revised)
|
|
|
Petroleum products |
-9.7 |
-7.9 |
|
Basic metals |
-2.6 |
8.1 |
|
Rubber and plastic products |
-1.5 |
2.6 |
|
Publishing and printing |
-3.5 |
2.8 |
|
Wood and wood products |
-6.0 |
21.1 |
|
Beverages |
-0.4 |
1.6 |
|
Textiles |
-0.8 |
-3.2 |
|
Furniture and fixtures |
-1.6 |
1.9 |
|
Gainers |
Year-on-Year Growth (%) |
|
|---|---|---|
| September 2013 |
August 2013
(revised)
|
|
|
Chemical products |
173.3 |
141.0 |
|
Furniture and fixtures |
167.9 |
194.5 |
|
Basic metals |
21.8 |
48.7 |
|
Food manufacturing |
4.4 |
2.9 |
|
Tobacco products |
34.4 |
34.9 |
|
Rubber and plastic products |
10.1 |
18.3 |
|
Machinery except electrical |
2.0 |
-15.6 |
|
Non-metallic mineral products |
6.0 |
19.8 |
|
Publishing and printing |
11.4 |
-13.2 |
|
Leather products |
43.0 |
29.1 |
|
Wood and wood products |
13.3 |
22.7 |
|
Losers |
Year-on-Year Growth (%) |
|
|---|---|---|
| September 2013 |
August 2013
(revised)
|
|
|
Petroleum products |
-17.2 |
-4.2 |
|
Transport equipment |
-26.8 |
-36.1 |
|
Electrical machinery |
-4.7 |
-9.9 |
|
Miscellaneous manufactures |
-41.2 |
-41.0 |
|
Footwear and wearing apparel |
-27.0 |
-28.6 |
|
Beverages |
-14.4 |
8.8 |
|
Textiles |
-19.5 |
-13.7 |
|
Paper and paper products |
-4.0 |
-10.8 |
|
Fabricated metal products |
-4.3 |
-16.1 |
|
Gainers |
Month-on-Month Growth (%) |
|
|---|---|---|
| September 2013 |
August 2013
(revised)
|
|
|
Machinery except electrical |
31.4 |
-22.4 |
|
Electrical machinery |
11.6 |
4.9 |
|
Chemical products |
13.3 |
11.6 |
|
Food manufacturing |
3.2 |
1.2 |
|
Miscellaneous manufactures |
16.7 |
-13.0 |
|
Transport equipment |
7.0 |
-16.9 |
|
Footwear and wearing apparel |
6.5 |
-14.0 |
|
Paper and paper products |
6.7 |
-4.4 |
|
Leather products |
35.0 |
-0.6 |
|
Non-metallic mineral products |
2.5 |
-1.8 |
|
Tobacco products |
3.2 |
-1.4 |
|
Furniture and fixtures |
2.5 |
1.7 |
|
Losers |
Month-on-Month Growth (%) |
|
|---|---|---|
|
September 2013 |
August 2013
(revised)
|
|
|
Petroleum products |
-8.5 |
-12.3 |
|
Basic metals |
-1.7 |
7.1 |
|
Publishing and printing |
-3.5 |
2.8 |
|
Rubber and plastic products |
-1.3 |
2.5 |
|
Wood and wood products |
-5.6 |
20.6 |
|
Beverages |
-0.4 |
1.6 |
|
Textiles |
-0.8 |
-3.5 |
|
Fabricated metal products |
-0.1 |
-1.4 |
|
Gainers |
Year-on-Year Growth (%) |
|
|---|---|---|
| September 2013 |
August 2013
(revised)
|
|
|
Chemical products |
192.6 |
180.1 |
|
Machinery except electrical |
38.5 |
17.2 |
|
Petroleum products |
12.5 |
9.0 |
|
Basic metals |
12.8 |
31.8 |
|
Textiles |
26.4 |
10.2 |
|
Tobacco products |
23.6 |
23.5 |
|
Furniture and fixtures |
46.4 |
72.1 |
|
Wood and wood products |
26.0 |
39.4 |
|
Fabricated metal products |
5.2 |
-3.5 |
|
Leather products |
29.8 |
10.4 |
|
Rubber and plastic products |
5.0 |
8.6 |
|
Paper and paper products |
0.4 |
0.3 |
|
Losers |
Year-on-Year Growth (%) |
|
|---|---|---|
| September 2013 |
August 2013
(revised)
|
|
|
Electrical machinery |
-10.3 |
-11.1 |
|
Food manufacturing |
-8.6 |
-3.5 |
|
Transport equipment |
-25.9 |
-35.9 |
|
Footwear and wearing apparel |
-26.7 |
12.7 |
|
Publishing and printing |
-39.3 |
-24.6 |
|
Beverages |
-9.0 |
20.3 |
|
Non-metallic mineral products |
-12.1 |
-9.9 |
|
Miscellaneous manufactures |
-3.4 |
-7.8 |
|
Gainers |
Month-on-Month Growth (%) |
|
|---|---|---|
| September 2013 |
August 2013
(revised)
|
|
|
Electrical machinery |
8.5 |
3.7 |
|
Chemical products |
12.0 |
9.2 |
|
Machinery except electrical |
6.1 |
-0.7 |
|
Basic metals |
6.9 |
1.7 |
|
Publishing and printing |
20.7 |
-5.6 |
|
Transport equipment |
5.4 |
-11.5 |
|
Miscellaneous manufactures |
11.8 |
-15.8 |
|
Textiles |
12.2 |
-12.0 |
|
Paper and paper products |
4.6 |
-4.9 |
|
Non-metallic mineral products |
2.4 |
-10.5 |
|
Furniture and fixtures |
4.7 |
-1.9 |
|
Fabricated metal products |
2.4 |
-4.8 |
|
Leather products |
12.7 |
-9.2 |
|
Beverages |
0.4 |
-2.0 |
|
Losers |
Month-on-Month Growth (%) |
|
|---|---|---|
| September 2013 |
August 2013
(revised)
|
|
|
Footwear and wearing apparel |
-25.4 |
25.3 |
|
Food manufacturing |
-2.6 |
5.7 |
|
Petroleum products |
-2.0 |
-2.4 |
|
Tobacco products |
-2.9 |
-1.8 |
|
Wood and wood products |
-7.2 |
27.0 |
|
Rubber and plastic products |
-1.7 |
-0.5 |
|
Gainers |
Year-on-Year Growth (%) |
|
|---|---|---|
| September 2013 |
August 2013
(revised)
|
|
|
Chemical products |
212.3 |
188.9 |
|
Machinery except electrical |
54.9 |
28.8 |
|
Basic metals |
31.0 |
49.6 |
|
Furniture and fixtures |
161.2 |
212.6 |
|
Petroleum products |
11.2 |
5.2 |
|
Tobacco products |
33.0 |
32.9 |
|
Textiles |
24.4 |
8.4 |
|
Rubber and plastic products |
14.4 |
29.3 |
|
Fabricated metal products |
8.3 |
-1.2 |
|
Wood and wood products |
21.1 |
36.2 |
|
Paper and paper products |
5.0 |
4.7 |
|
Leather products |
28.4 |
9.0 |
|
Losers |
Year-on-Year Growth (%) |
|
|---|---|---|
| September 2013 |
August 2013
(revised)
|
|
|
Electrical machinery |
-11.2 |
-12.8 |
|
Footwear and wearing apparel |
-31.3 |
8.0 |
|
Transport equipment |
-17.0 |
-29.9 |
|
Beverages |
-13.7 |
14.1 |
|
Food manufacturing |
-3.5 |
3.1 |
|
Publishing and printing |
-44.4 |
-30.8 |
|
Non-metallic mineral products |
-11.5 |
-11.8 |
|
Miscellaneous manufactures |
-14.0 |
-12.4 |
|
Gainers |
Month-on-Month Growth (%) |
|
|---|---|---|
| September 2013 |
August 2013
(revised)
|
|
|
Electrical machinery |
10.5 |
1.2 |
|
Chemical products |
13.2 |
9.7 |
|
Machinery except electrical |
9.0 |
-2.7 |
|
Basic metals |
8.0 |
0.7 |
|
Transport equipment |
6.6 |
-10.3 |
|
Miscellaneous manufactures |
13.5 |
-17.8 |
|
Publishing and printing |
20.7 |
-5.6 |
|
Textiles |
12.2 |
-12.3 |
|
Paper and paper products |
5.8 |
-5.0 |
|
Non-metallic mineral products |
2.8 |
-11.0 |
|
Furniture and fixtures |
9.1 |
-2.0 |
|
Leather products |
12.9 |
-9.3 |
|
Beverages |
0.4 |
-2.0 |
|
Fabricated metal products |
1.3 |
-3.4 |
|
Losers |
Month-on-Month Growth (%) |
|
|---|---|---|
| September 2013 |
August 2013
(revised)
|
|
|
Footwear and wearing apparel |
-25.6 |
25.7 |
|
Food manufacturing |
-2.5 |
3.9 |
|
Petroleum products |
-0.7 |
-7.1 |
|
Tobacco products |
-2.9 |
-1.8 |
|
Wood and wood products |
-6.8 |
26.5 |
|
Rubber and plastic products |
-1.5 |
-0.5 |