
|
Table A Year-on-Year Growth Rates for Production Index, Net Sales Index
and Producer Price Index :September 2016 and September 2015
|
||
|---|---|---|
|
TOTAL MANUFACTURING |
SEPTEMBER
2016
|
SEPTEMBER
2015
|
|
Production Index (2000=100) |
|
|
|
Value (VaPI) |
5.4 |
-5.4 |
|
Volume (VoPI) |
9.9 |
3.0 |
|
Net Sales Index (2000=100) |
|
|
|
Value (VaNSI) |
5.6 |
-9.7 |
|
Volume (VoNSI) |
10.1 |
-1.6 |
|
Producer Price Index (2000=100) |
-3.7r |
-7.9 |
r - revised
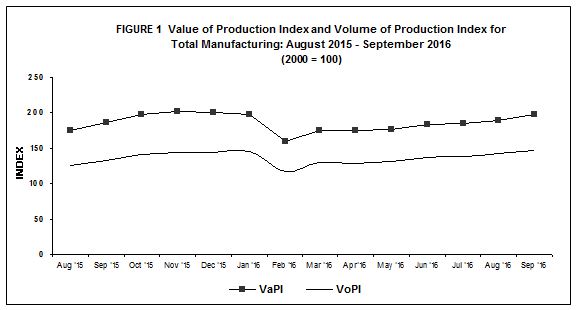
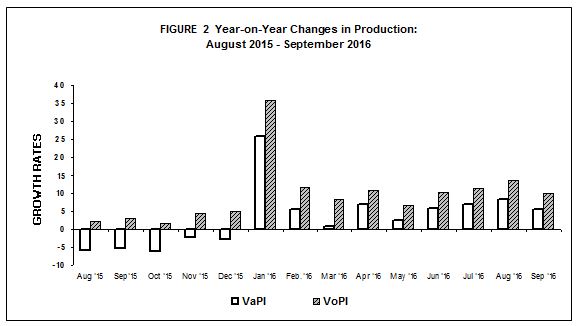
- Value of Production Index accelerates in September 2016
Value of Production Index (VaPI) grew at 5.4 percent in September 2016 compared with the negative 5.4 percent during the same month of last year, according to the preliminary results of the Monthly Integrated Survey of Selected Industries (MISSI). Among the 12 major sectors that reported increases in VaPI, seven major sectors significantly contributed to the growth, namely: basic metals (32.8%), rubber and plastic products (28.3%), transport equipment (21.3%), printing (14.7%), machinery except electrical (12.7%), wood and wood products (12.7%) and food manufacturing (10.7%). Refer to Tables 1-A and 1.
- Volume of Production Index likewise expands
Volume of Production Index (VoPI) continued to grow as it reported an annual increase of 9.9 percent in September 2016. Major sectors that largely contributed to the expansion in VoPI were basic metals (41.0%), machinery except electrical (35.0%), rubber and plastic products (30.5%), transport equipment (22.3%), petroleum products (21.6%), printing (15.5%) and wood and wood products (14.8). Refer to Tables 1-B and 2.
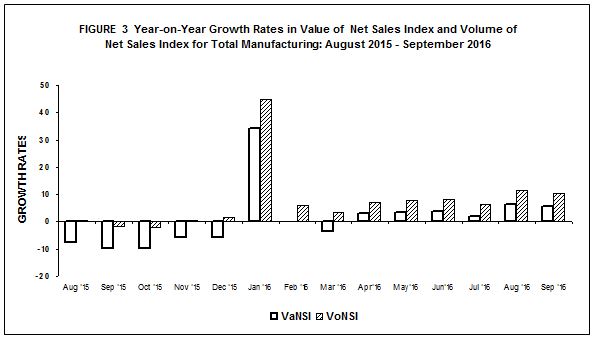
- Value of Net Sales Index also picks up
Value of Net Sales Index (VaNSI) went up by 5.6 percent, a reversal from the negative rate of 9.7 percent in September 2015. The increase in VaNSI was exhibited by fifty percent of the 20 major sectors, with eight significantly contributing to the growth, namely: wood and wood products (71.0%), transport equipment (30.6%), basic metals (26.3%), rubber and plastic products (15.1%), non-metallic mineral products (14.7%), machinery except electrical (14.6%), printing (14.5%) and beverages (10.0%). Refer to Tables 2-A and 3.
- Volume of Net Sales Index sustains two-digit growth
Volume of Net Sales Index (VoNSI) maintained its two-digit growth of 10.1 percent in September 2016 compared with the negative 1.6 percent during the same month of last year. The increase in 13 major sectors, pulled up VoNSI. The eight major sectors that exhibited two-digit growth in VoNSI were wood and wood products (74.3%), machinery except electrical (37.3%), basic metals (34.1%), transport equipment (31.7%), rubber and plastic products (17.1%), printing (15.3%), non-metallic mineral products (12.4%), and petroleum products (11.2%). Refer to Tables 2-B and 4.
- Average Capacity Utilization Rate in September 2016 is 83.6 percent with basic metals posting the highest among industries
Average capacity utilization rate in September 2016 for total manufacturing was recorded at 83.6 percent. Fifty-five percent or 11 of the 20 major industries operated at 80 percent and above capacity utilization rates. These were:
- basic metals (88.5%)
- petroleum products (88.4%)
- non-metallic mineral products (86.5%)
- machinery except electrical (85.4%)
- food manufacturing (84.6%)
- chemical products (84.5%)
- electrical machinery (84.5%)
- paper and paper products (83.2%)
- rubber and plastic products (82.9%)
- wood and wood products (81.1%)
- printing (80.3%)
The proportion of establishments that operated at full capacity (90% to 100%) was 23.6 percent in September 2016. About 58.2 percent of the establishments operated at 70 percent to 89 percent capacity while 18.2 percent of the establishments operated below 70 percent capacity. Refer to Table B and 6.
|
Table B Distribution of Key Manufacturing Establishments by Capacity Utilization for Total Manufacturing: September 2016 |
|
|---|---|
|
Capacity Utilization |
Percent Share |
|
Below 50% |
3.4 |
|
50% - 59% |
4.8 |
|
60% - 69% |
10.0 |
|
70% - 79% |
23.7 |
|
80% - 89% |
34.5 |
|
90% - 100% |
23.6 |
- Industry Coverage
The 2016 MISSI utilizes the 2009 PSIC to classify major industries and sub-industries. Twenty major industries of the 2009 PSIC were formed to comprise the industry coverage of the 2016 MISSI. These are presented in the table below.
|
2009 PSIC CODE |
INDUSTRY DESCRIPTION |
|---|---|
|
C10 |
Food manufacturing * |
|
C11 |
Beverages |
|
C12 |
Tobacco products |
|
C13 |
Textiles* |
|
C14, C152 |
Footwear and wearing apparel |
|
C151 |
Leather products |
|
C16 |
Wood and wood products* |
|
C17 |
Paper and paper products |
|
C18 |
Printing |
|
C19 |
Petroleum products* |
|
C20,C21 |
Chemical products* |
|
C22 |
Rubber and plastic products* |
|
C23 |
Non-metallic mineral products* |
|
C24 |
Basic metals* |
|
C25,C3311 |
Fabricated metal products |
|
C262,C275,C28, C263,C268,C3312,C332 |
Machinery except electrical* |
|
C261,C264,C27, C29301,C3314,C332 |
Electrical machinery* |
|
C29 except C29301, C30,C3315 |
Transport equipment |
|
C31 |
Furniture and fixtures |
|
C265,C266,C267,C32, C3313,C3319 |
Miscellaneous manufactures |
|
Note: * - Major industries categorized into sub-industries |
|
- Response Rate
The response rates for the September 2016 MISSI and PPS are 76.0 and 81.8 percent, respectively. Refer to Tables 7 and 8.
|
Table C Response Rates for Total Manufacturing
(In percent)
|
||
|---|---|---|
|
|
September 2016 |
August 2016
(Revised)
|
|
MISSI |
76.0 |
91.2r |
|
PPS |
81.8r |
89.1r |
Data of non-responding samples were estimated using short-term geometric mean of the relative values of responding samples within the industry class. Revisions to the preliminary estimates are done upon receipt of actual reports of late respondents.
TABLE 1-A Value of Production Index, August 2016 and September 2016
(2000 =100)
|
Gainers |
Year-on-Year Growth (%) |
|
|---|---|---|
| September 2016 |
August 2016
(revised)
|
|
|
Food manufacturing |
10.7 |
14.37 |
|
Basic metals |
32.8 |
33.9 |
|
Machinery except electrical |
12.7 |
18.7 |
|
Petroleum products |
8.9 |
-6.8 |
|
Transport Equipment |
21.3 |
30.1 |
|
Rubber and plastic products |
28.3 |
40.3 |
|
Chemical products |
8.8 |
7.3 |
|
Beverages |
7.4 |
15.2 |
|
Printing |
14.7 |
-0.1 |
|
Textiles |
6.9 |
-9.4 |
|
Wood and wood products |
12.7 |
8.8 |
|
Non-metallic mineralproducts |
0.8 |
1.4 |
|
Losers |
Year-on-Year Growth (%) |
|
|---|---|---|
| September 2016 |
August 2016
(revised)
|
|
|
Electrical machinery |
-10.7 |
-3.7 |
|
Fabricated metal products |
-48.8 |
-17.8 |
|
Furniture and fixtures |
-35.5 |
-18.3 |
|
Footwear and wearing apparel |
-8.5 |
3.2 |
|
Tobacco products |
-12.9 |
12.1 |
|
Leather products |
-88.8 | -86.8 |
|
Miscellaneous manufactures |
-5.9 |
-8.2 |
|
Paper and paper products |
-3.0 |
2.4 |
TABLE 1-B Volume of Production Index, August 2016 and September 2016
(2000 = 100)
|
Gainers |
Year-on-Year Growth (%) |
|
|---|---|---|
|
September 2016
(revised)
|
August 2016
(revised)
|
|
|
Machinery except electrical |
35.0 |
45.0 |
|
Petroleum products |
21.6 |
2.3 |
|
Basic metals |
41.0 |
41.4 |
|
Food manufacturing |
8.3 |
12.2 |
|
Transport equipment |
22.3 |
31.4 |
|
Rubber and plastic products |
30.5 |
44.2 |
|
Chemical products |
9.9 |
9.5 |
|
Printing |
15.5 |
0.7 |
|
Beverages |
3.0 |
10.4 |
|
Textiles |
6.7 |
-8.7 |
|
Wood and wood products |
14.8 |
11.6 |
|
Losers |
Year-on-Year Growth (%) |
|
|---|---|---|
| September 2016 |
August 2016
(revised)
|
|
|
Electrical machinery |
-9.6 |
-4.0 |
|
Fabricated metal products |
-47.9 |
-16.3 |
|
Tobacco products |
-13.0 |
11.9 |
|
Miscellaneous manufactures |
-10.9 |
-11.2 |
|
Leather products |
-87.5 | -84.3 |
|
Furniture and Fixtures |
-20.0 | 10.2 |
|
Footwear and wearing apparel |
-5.0 | 8.9 |
|
Non-metallic mineral products |
-1.3 | 0.1 |
|
Paper and paper products |
-1.7 |
3.0 |
TABLE 2-A Value of Net Sales Index, August 2016 and September 2016
(2000 =100)
|
Gainers |
Year-on-Year Growth (%) |
|
|---|---|---|
| September 2016 |
August 2016
(revised)
|
|
|
Machinery except electrical |
14.6 |
24.6 |
|
Transport equipment |
30.6 |
-8.1 |
|
Food manufacturing |
7.8 |
11.6 |
|
Basic metals |
26.3 |
36.7 |
|
Chemical products |
6.2 |
8.0 |
|
Beverages |
10.0 |
14.8 |
|
Non-metallic mineral products |
14.7 |
0.1 |
|
Wood and wood products |
71.0 |
28.6 |
|
Rubber and plastic products |
15.1 |
24.7 |
|
Prinitng |
14.5 |
-6.1 |
|
Losers |
Year-on-Year Growth (%) |
|
|---|---|---|
| September 2016 |
August 2016
(revised)
|
|
|
Electrical machinery |
-4.4 |
0.3 |
|
Fabricated metal products |
-45.3 |
-23.8 |
|
Footwear and wearing apparel |
-19.5 |
-10.7 |
|
Tobacco products |
-9.7 |
-5.1 |
|
Textiles |
-8.0 |
-1.9 |
|
Furniture and fixtures |
-17.1 |
-11.5 |
|
Miscellaneous manufactures |
-3.8 | -22.6 |
|
Paper and paper products |
-3.9 | 8.3 |
|
Petroleum products |
-0.4 | 0.9 |
|
Leather products |
-9.5 |
6.6 |
TABLE 2-B Volume of Net Sales Index, August 2016 and September 2016
(2000 = 100)
|
Gainers |
Year-on-Year Growth (%) |
|
|---|---|---|
| September 2016 |
August 2016
(revised)
|
|
|
Machinery except electrical |
37.3 |
52.2 |
|
Basic metals |
34.1 |
44.4 |
|
Transport equipment |
31.7 |
-7.2 |
|
Petroleum products |
11.2 |
10.7 |
|
Food manufacturing |
5.5 |
9.5 |
|
Chemical products |
7.3 |
10.2 |
|
Wood and wood products |
74.3 |
31.9 |
|
Non-metallic mineral products |
12.4 |
-1.2 |
|
Beverages |
5.5 |
10.0 |
|
Rubber and plastic products |
17.1 |
28.2 |
|
Printing |
15.3 |
-5.3 |
|
Furniture and fixtures |
2.7 |
19.4 |
|
Leather products |
1.1 |
27.2 |
|
Losers |
Year-on-Year Growth (%) |
|
|---|---|---|
| September 2016 |
August 2016
(revised)
|
|
| Fabricated metal products |
-44.3 |
-22.5 |
|
Electrical machinery |
-3.2 |
1/ |
|
Footwear and wearing apparel |
-16.5 |
-5.8 |
|
Tobacco products |
-9.8 |
-5.2 |
|
Miscellaneous manufactures |
-8.9 |
-25.2 |
|
Textiles |
-8.2 |
-1.2 |
|
Paper and paper products |
-2.5 |
8.9 |