
Release Date :
Reference Number :
2017-18
Explanatory Notes
| Data on marriages presented in this release were obtained from the Certificates of Marriage (Municipal Form No. 97) that were registered at the Office of the City/Municipal Civil Registrars all throughout the country and forwarded to the Philippine Statistics Authority. Information presented include registered marriages which occurred from January to December 2015. Figures presented are not adjusted for under-registration. Marriages of Filipinos abroad which were reported to the Philippine Foreign Service Posts are presented in a separate report. |
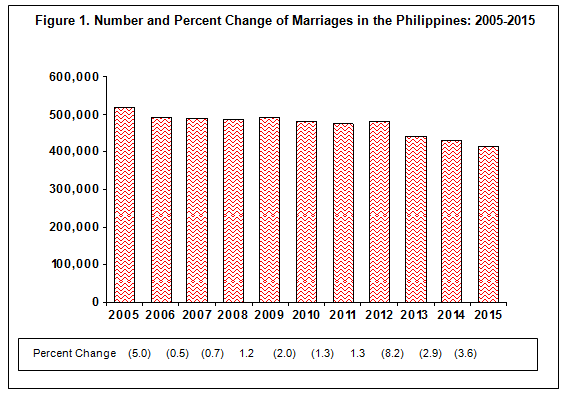
Continuous decline in marriages
The number of registered marriages showed an erratic trend for the past 10 years. The most notable change occurred in 2013 which recorded a decrease of 8.2 percent from 482,399 in 2012 to 442,603. It is also interesting to note that from that year up to 2015, the number of marriages declined continuously. Registered marriages declined by 2.9 percent in 2014 and 3.6 percent in 2015. (See Figure 1 and Table 1)
In a span of 10 years, the reported marriages decreased by 20.1 percent from 2005 to 2015.
NCR consistently had the highest record of marriages
In 2015, the National Capital Region (NCR) recorded the highest number of registered marriages, which accounted for 14.0 percent of the total marriages. It was followed by Region IV-A (13.0%) and Region III (11.6%). These regions were consistently in the top three for the past five years in the same order.
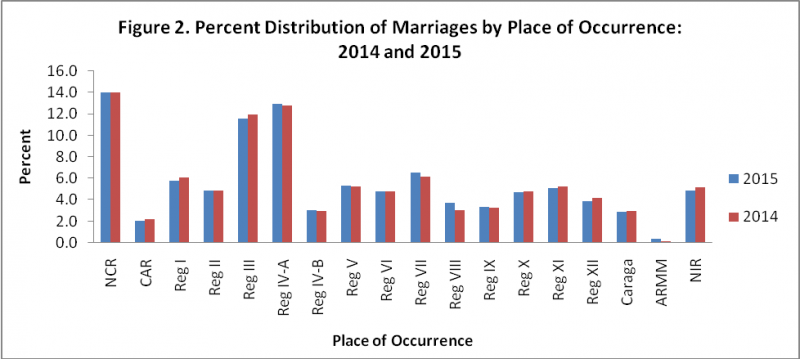
Meanwhile, ARMM showed the highest percent change of increase in the number of registered marriages (87.2 %) from 2014 to 2015.
The newly created Negros Island Region (NIR) comprising the provinces of Negros Occidental and Negros Oriental recorded a total of 20,406 registered marriages in 2015, down by 7.8 percent in 2014.
Fifteen out of 18 regions had decreased in the number of registered marriages in 2015. (See Figure 2 and Table 2)
Most couples prefer to marry in May
In 2015, the most preferred month to get married was May with 50,469 (12.2%) of the total marriages. It was followed by the months of February (11.1%) and April (10.4%).
The least number of marriages occurred in November with 21,352 or 5.2 percent of the total marriages.
An average of 1,135 couples married per day in 2015. (See Table 3)
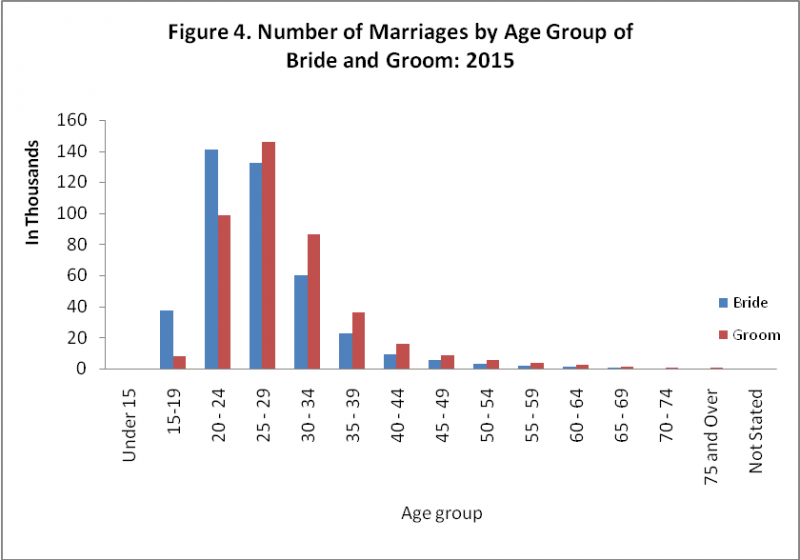
Women marry at an early age than men
The median age at marriage for brides and grooms are 26 and 28, respectively.

Most of the brides marry at ages 20-24 (140,738 or 34.0%). On the other hand, majority of the grooms preferred to marry between the ages of 25-29 (145,952 or 35.2%).
Marriages involving teenage brides were five times more than marriage with teenage grooms. It was also observed that there were marriages recorded involving adolescents aged under 15. (See Figure 4 and Table 4)
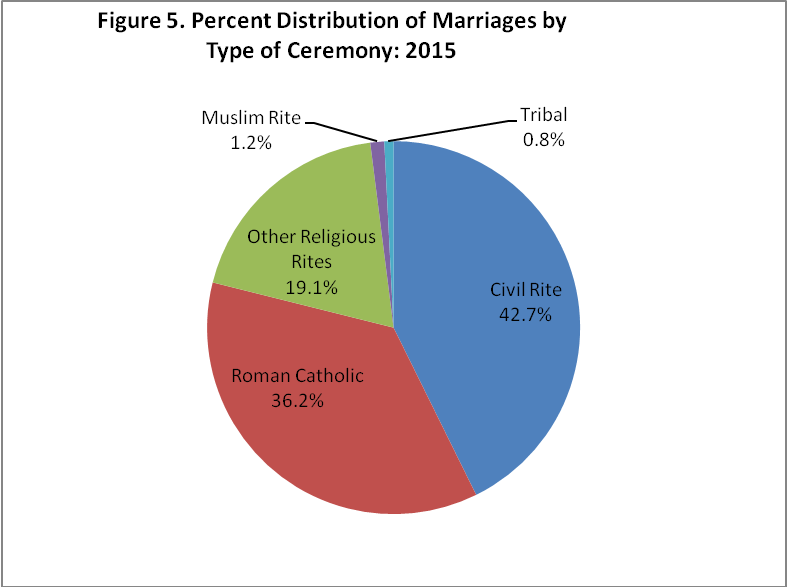
Four out of ten marriages were solemnized through civil rites
There were 1,135 marriages solemnized daily through different ceremonies in 2015. Of the total marriages, 42.7 percent were contracted through civil rites. Other matrimonial ceremonies were officiated in Roman Catholic churches (36.2%), other religious sect rites (19.1%), Muslim tradition (1.2%) and tribal wedding rite (0.8%). (See Figure 5)
While most brides preferred to marry between ages 20-24, those marriages which were solemnized in Muslim and other religious sect rites were older (25-29). On the other hand, regardless of preferences of wedding ceremony, most grooms preferred to marry between ages 25-29 through different ceremonies, except for those who marry in tribal rites, which involved younger grooms aged 20-24. (See Table 5a and 5b)
Filipino brides with foreign grooms prefer American nationals
Of the total number of marriages which occurred in the Philippines in 2015 about 3.6 percent involved foreign nationals. American nationals were preferred by Filipino brides (0.75%) and Australians (0.07%) by Filipino grooms.
Other common nationalities of the groom are Japanese (0.39%), Australian (0.23%) and Korean (0.22%). On the other hand, Filipino grooms also preferred to marry American (0.06%) and Canadian (0.04%). (See Table 6)
| Attachment | Size |
|---|---|
|
|
217.77 KB |
|
|
84.86 KB |