Release Date :
Reference Number :
2013-129
Population of Misamis Oriental (excluding Cagayan de Oro City) increased at the rate of 2.05 percent annually
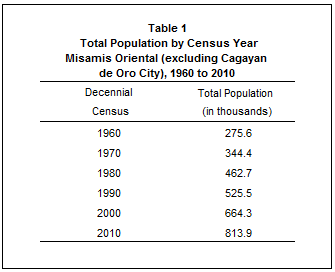
Based on the 2010 Census of Population and Housing (CPH), the province of Misamis Oriental, excluding Cagayan de Oro City, posted a total population of 813,856 persons as of May 1, 2010. This is larger by 149,518 persons compared to its total population of 664,338 persons counted in the 2000 CPH. The increase in the population count from 2000 to 2010 translated to an average annual population growth rate (PGR) of 2.05 percent. This is lower than the 2.37 percent annual PGR of the province between the census years 1990 and 2000.
If the average annual PGR recorded at 2.05 percent during the period 2000 to 2010 continues, the population of Misamis Oriental would double in 34 years.
Fifty years ago, the population of Misamis Oriental was only 275,624 persons. This population size is less than one third of the population in the 2010 CPH.
Gingoog City was the most populous
Among the two cities and 23 municipalities comprising the province of Misamis Oriental, Gingoog City was the most populous with a population size making up 14.5 percent of the total provincial population. It was followed by Balingasag with 8.1 percent, Tagoloan with 7.8 percent, Opol with 6.4 percent, Jasaan with 6.2 percent, and City of El Salvador and Claveria with 5.5 percent each. The rest of the municipalities contributed less than 5.0 percent each.
The least populated municipality was Binuangan with 0.8 percent share to the total population of the province. In 2000, Binuangan was also the least populated area.

Sex ratio was 105 males per 100 females
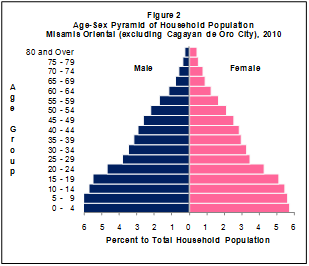
Of the 812,626 household population in 2010, males accounted for 51.3 percent while females comprised 48.7 percent. These figures resulted in a sex ratio of 105 males for every 100 females, which is similar to the sex ratio recorded in 2000 (104 males per 100 females).
Median age increased to 22.6 years
In 2010, the median age of the population of the province was 22.6 years, which means that half of the population was younger than 22.6 years. This is higher than the median age of 20.8 years that was recorded in 2000.
Moreover, 34.7 percent of the household population were under 15 years old. Children aged 0 to 4 years (11.8 percent) comprised the largest age group, followed by those in the age groups 5 to 9 years (11.6 percent) and 10 to 14 years (11.2 percent). Males outnumbered females in the age groups 0 to 59 years. On the other hand, there were more females than males in the older age groups (65 years and over).
Approximately three fifths of the population were of voting age
The voting-age population (18 years and over) accounted for 58.9 percent of the household population of the province in 2010, up from 55.3 percent in 2000. There were more males (51.0 percent) than females (49.0 percent) among the voting-age population.
Dependency ratio decreased to 65 dependents per 100 persons in the working age group
In 2010, the young dependents (0 to 14 years) comprised 34.7 percent of the household population while the old dependents (65 years and over) posted a share of 4.6 percent. The working-age population (15 to 64 years) accounted for the remaining 60.7 percent.
The overall dependency ratio was 65, which indicates that for every 100 working-age population, there were about 65 dependents (57 young dependents and eight old dependents). This ratio is lower than the dependency ratio in 2000, which was recorded at 73 dependents per 100 working-age population (66 young dependents and seven old dependents).
There were more males than females among the never-married persons
Of the household population 10 years old and over, 45.7 percent were married while 43.4 percent were never married. The rest of the population were categorized as follows: in common-law/live-in marital arrangement (5.4 percent), widowed (4.3 percent), and divorced/separated (1.1 percent).
Among the never-married persons, 55.6 percent were males while 44.4 percent were females. For the rest of the categories for marital status, the females outnumbered the males.
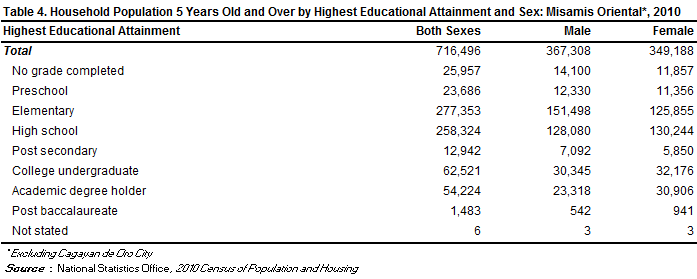
More females had attained higher levels of education
Of the household population aged five years and over, 38.7 percent had attended or completed elementary education, 36.1 percent had reached or finished high school, 8.7 percent were college undergraduates, and 7.6 percent were academic degree holders. Among those with an academic degree, the females (57.0 percent) outnumbered the males (43.0 percent). Similarly, more females (63.5 percent) than males (36.5 percent) had pursued post baccalaureate courses.
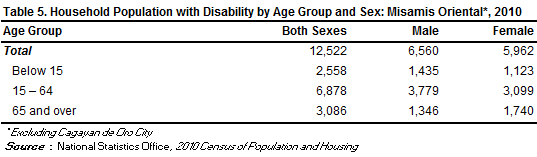
Persons with disability comprised 1.5 percent of the population in the province
In 2010, 12,500 persons or 1.5 percent of the 812,626 household population had a disability. This proportion of persons with disability (PWD) is higher than the proportion in 2000, which was 1.3 percent of the 663,705 household population of the province during that year. The number of PWD for the same year was around 8,300.
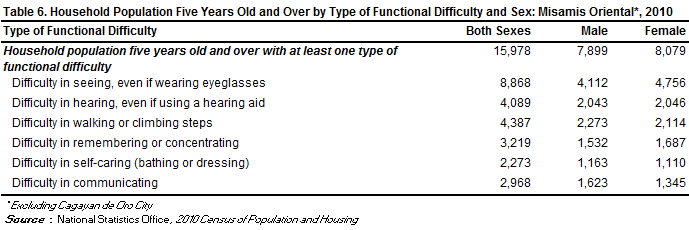
More females than males among those with functional difficulty
Of the 716,496 household population five years and over, 2.2 percent (or 15,978 persons) had at least one type of functional difficulty either in seeing, hearing, walking or climbing steps, remembering or concentrating, self-caring (bathing or dressing), or communicating. There were more females (50.6 percent) than males (49.4 percent) among those persons with at least one type of functional difficulty.
Moreover, of the total 15,978 persons aged five years and over with at least one type of functional difficulty, 55.5 percent reported difficulty in seeing, even if wearing eyeglasses. There were 27.5 percent who had difficulty in walking or climbing steps; 25.6 percent had difficulty in hearing, even if using a hearing aid; 20.1 percent had difficulty in remembering or concentrating; 18.6 percent had difficulty in communicating; and 14.2 percent had difficulty in self-caring (bathing or dressing).
Male overseas workers outnumbered their female counterparts
Of the 621,892 household population 10 years old and over in Misamis Oriental, 1.3 percent (or 7,800 persons) were overseas workers. Male overseas workers outnumbered their female counterparts as they comprised 58.9 percent of all the overseas workers from this province. Overseas workers aged group 30 to 34 years made up the largest age group, comprising 20.6 percent of the total overseas workers from this province in 2010, followed by the age groups 25 to 29 years (19.4 percent), 45 years and over (18.7 percent), and 35 to 39 years (17.9 percent).
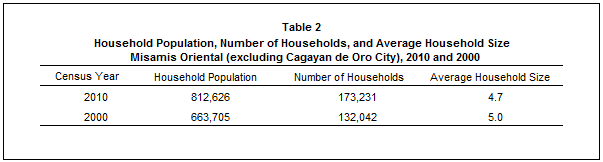
Average household size was 4.7 persons
The number of households in 2010 was recorded at 173,231, higher by 41,189 households compared with the 132,042 households posted in 2000. The average household size in 2010 was 4.7 persons, lower than the average household size of 5.0 persons in 2000.
There were 101 households per 100 occupied housing units
A total of 171,511 occupied housing units were recorded in the province of Misamis Oriental in 2010. This translates to a ratio of 101 households for every 100 occupied housing units, with 4.7 persons per occupied housing unit. In 2000, there were 101 households per 100 occupied housing units, and 5.1 persons per occupied housing unit.
Occupied housing units with outer walls and roofs made of light materials decreased
In 2010, 38.0 percent of the occupied housing units in the province had outer walls made of wood, down from 50.8 percent in 2000. The proportion of occupied housing units with outer walls made of concrete/brick/stone increased from 16.8 percent in 2000 to 26.0 percent in 2010. Those with walls made of bamboo/sawali/cogon/nipa, on the other hand, increased from 16.0 percent in 2000 to 20.5 percent in 2010. Meanwhile, 77.7 percent of the occupied housing units in 2010 had roofs made of galvanized iron/aluminum, higher than the proportion of 70.1 percent recorded in 2000. Those with roofs made of cogon/nipa/anahaw decreased from 23.8 percent in 2000 to 17.4 percent in 2010.
Three fifths of the households lived in lots that they owned or amortized
In 2010, of the total 173,231 households, 60.2 percent owned or amortized the lots that they occupied. The corresponding figure in 2000 was 50.4 percent.
Moreover, 29.7 percent of the households occupied lots which were rent-free but with consent of the owner, 6.1 percent rented the lots that they occupied while 1.5 percent occupied lots which were rent-free but without consent of the owner.
(Sgd) CARMELITA N. ERICTA
Administrator