
|
Table A Year-on-Year and Month-on-Month Growth Rates of Producer Price Index:
February 2018, January 2018 and February 2017
|
|||
|---|---|---|---|
|
TOTAL MANUFACTURING |
February
2018
|
January
2018
|
February
2017
|
|
Producer Price Index (2000=100) |
132.5 |
132.3 r |
134.2 |
|
Year-on-Year Growth |
-1.3 |
-1.3 |
-1.2 |
|
Month-on-Month Growth |
0.1 |
0.4 |
0.1 |
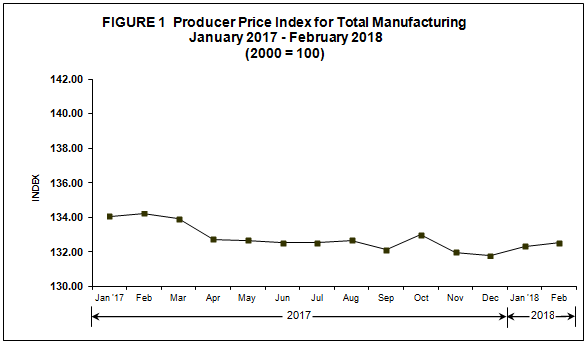
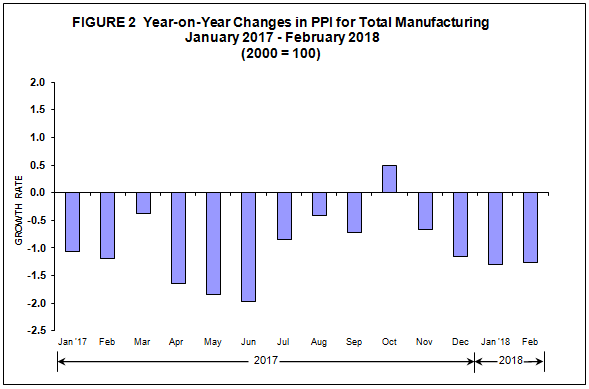
- Producer Price Index slightly decreases in February 2018
The Producer Price Index (PPI, 2000=100) for total manufacturing dropped at a slower rate of 1.3 percent in February 2018 from a negative growth of 1.2 percent during the same period of previous year. This can be attributed to the substantial decline of three major sectors namely; leather products, fabricated metal products and rubber and plastic products, which decreased by 16.0 percent, 15.5 percent and 13.7 percent, respectively. Refer to Tables 1 and A-1.
By month, PPI posted a positive growth with 0.1 percent from previous month’s rate of 0.4 percent with furniture and fixtures (2.8%) dominating the increase along with other 14 major sectors, while five sectors posted decreases. Refer to Tables 1 and A-2.
|
INDUSTRY GROUP |
Year-on-Year Growth (percent) |
|
| February 2018 |
January 2018
(revised)
|
|
|
Gainers |
|
|
|
Tobacco Products |
53.4 |
52.1 |
|
Petroleum Products |
5.1 |
15.3 |
|
Electrical Machinery |
2.2 |
2.5 |
|
Basic Metals |
3.8 |
3.2 |
|
Machinery Except Electrical |
2.5 |
2.7 |
|
Non- Metallic Mineral Products |
3.5 |
2.9 |
|
Beverages |
2.4 |
2.1 |
|
Miscellaneous Manufactures |
5.4 |
3.7 |
|
Paper & Paper Products |
1.8 |
0.5 |
|
Furniture & Fixtures |
1.0 |
0.5 |
|
Losers |
|
|
|
Food Manufacturing |
-3.2 |
-3.6 |
|
Rubber and plastic products |
-13.7 |
-13.5 |
|
Fabricated Metal Products |
-15.5 |
-19.6 |
|
Chemical Products (excludes plastic) |
-3.7 |
-2.7 |
|
Leather Products |
-16.0 |
-12.1 |
|
Transport Equipment |
-0.7 |
-2.7 |
|
Footwear & Wearing Apparel |
-3.7 |
-4.7 |
|
Printing |
-2.0 |
-1.4 |
|
Wood & Wood Products |
-0.7 |
-0.7 |
|
Textiles |
-0.1 |
0.1 |
|
INDUSTRY GROUP |
Month-on-Month Growth (percent) |
|
|---|---|---|
| February 2018 |
January 2018
(revised)
|
|
|
Gainers |
|
|
|
Basic Metals |
1.7 |
4.4 |
|
Transport Equipment |
0.7 |
-0.1 |
|
Electrical Machinery |
0.5 |
1.2 |
|
Non- Metallic Mineral Products |
1.0 |
2.9 |
|
Machinery Except Electrical |
0.6 |
4.1 |
|
Furniture & Fixtures |
2.8 |
4.9 |
|
Footwear & Wearing Apparel |
1.0 |
-0.1 |
|
Miscellaneous Manufactures |
0.8 |
4.7 |
|
Rubber and plastic products |
0.3 |
-11.7 |
|
Paper & Paper Products |
0.4 |
1.8 |
|
Fabricated Metal Products |
0.2 |
1.3 |
|
Wood & Wood Products |
0.2 |
0.5 |
|
Textiles |
a/ |
-0.6 |
|
Printing |
a/ |
-2.6 |
|
Tobacco Products |
0.3 |
11.8 |
|
Losers |
|
|
|
Petroleum Products |
-7.9 |
17.7 |
|
Chemical Products (excludes plastic) |
-1.1 |
-1.3 |
|
Food Manufacturing |
-0.2 |
-1.2 |
|
Leather Products |
-3.6 |
5.5 |
|
Beverages |
b/ |
2.6 |
- Response Rate
The response rate for February 2018 is 76.7 percent, which corresponds to the retrieval of 580 establishments’ reports out of the 756 samples for the survey. Refer to Tables 2 and B..
|
Table B Response Rates For Total Manufacturing
(In Percent)
|
|
|---|---|
|
January 2018 |
December 2017
(revised)
|
|
76.7
|
86.6r
|
Missing prices for products of sample establishments are estimated using the short-term geometric mean of the actual prices of responding samples within the same industry class. Revisions to the preliminary estimates are done upon receipt of actual reports from late responding establishments.
- Introduction
- Method of Index Computation
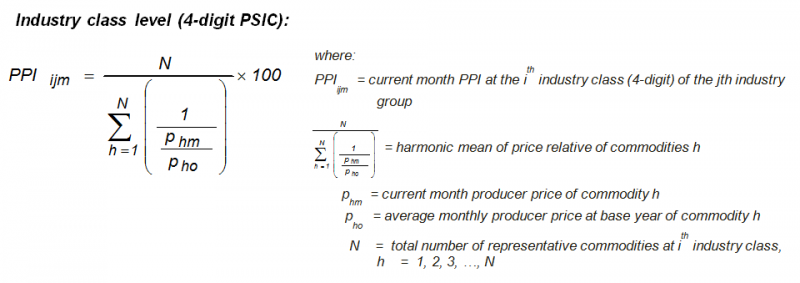

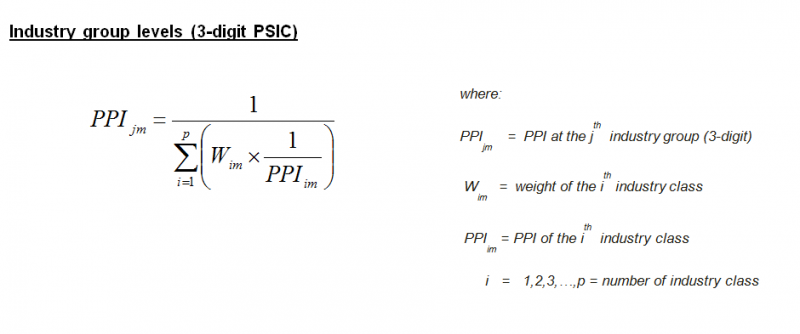
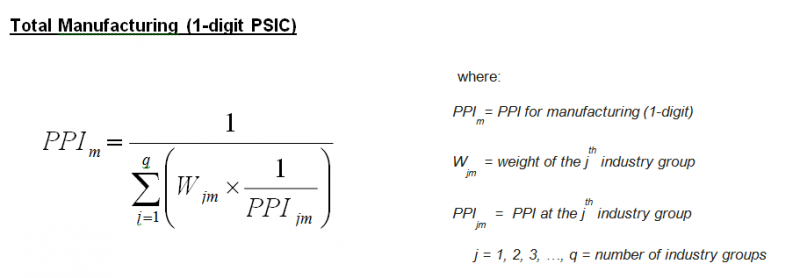
Starting with January 2017 PPI, a link factor has been used to adjust weight effects and measure the correct price change.
- Industry Coverage
Starting with January 2013 reference month, the PPI utilizes the 2009 Philippine Standard Industrial Classification (PSIC) to classify sectors and industries. Selected industry classes of the 2009 PSIC were grouped to form the 20 industry groupings of the 2018 PPS. These are presented in the table below.
|
2009 PSIC CODE |
INDUSTRY DESCRIPTION |
|---|---|
|
C10 |
Food manufacturing * |
|
C11 |
Beverages |
|
C12 |
Tobacco products |
|
C13 |
Textiles* |
|
C14,C152 |
Footwear and wearing apparel |
|
C151 |
Leather products |
|
C16 |
Wood and wood products* |
|
C17 |
Paper and paper products |
|
C18 |
Printing and reproduction of recorded media |
|
C19 |
Petroleum products* |
|
C20,C21 |
Chemical products* |
|
C22 |
Rubber and plastic products* |
|
C23 |
Non-metallic mineral products* |
|
C24 |
Basic Metals* |
|
C25 |
Fabricated metal products |
|
C262,C275,C28,C263,C268 |
Machinery except electrical* |
|
C261,C264,C27,C29301 |
Electrical machinery* |
|
C29 except C29301,C30 |
Transport equipment |
|
C31 |
Furniture and fixtures |
|
C265,C266,C267,C32 |
Miscellaneous manufactures |
Note: * - Major sectors categorized into sub-sectors
| Attachment | Size |
|---|---|
|
|
54.14 KB |
|
|
13 KB |