
|
Table A Year-on-Year and Month-on-Month Growth Rates of Producer Price Index:
July 2016, June 2016 and July 2015
|
|||
|---|---|---|---|
|
TOTAL MANUFACTURING |
July
2016
|
June
2016
|
July
2015
|
|
Producer Price Index (2000=100) |
133.5 |
134.5 r |
139.2 |
|
Year-on-Year Growth |
- 4.1 |
- 4.2 r |
- 6.7 |
|
Month-on-Month Growth |
-0.8 |
0.0 r |
- 0.8 |
- Producer Price Index declines in July 2016
The Producer Price Index (PPI, 2000=100) for manufacturing decreased at a slower rate of 4.1 percent in July 2016 compared with a negative 6.7 percent during the same period last year. The slowdown can be attributed to the double-digit decrements posted by the following major sectors: furniture and fixtures (-23.1%), machinery except electrical (-16.4%) and petroleum products (-11.8%). On the other hand, miscellaneous manufactures (5.9%) continued to lead the eight major sectors that posted increases. Refer to Tables 1 and A-1.
On a monthly basis, the PPI likewise went down by 0.8 percent in July from a flat rate posted a month earlier. This was influenced by the decreases observed in ten major sectors including the two heavily-weighted sectors namely: petroleum products (-2.5%) and electrical machinery (-1.9%). Furthermore, five sectors posted flat growths and five sectors reflected increases. Refer to Tables 1 and A-2.
|
Gainers |
Year-on-Year Growth (percent) |
|
|---|---|---|
| July 2016 |
June 2016
(revised)
|
|
|
Food Manufacturing |
1.4 |
1.4 |
|
Beverages |
4.4 |
4.4 |
|
Electrical Machinery |
0.5 |
0.2 |
|
Miscellaneous Manufactures |
5.9 |
6.2 |
|
Non-Metallic Mineral Products |
2.1 |
2.7 |
|
Fabricated Metal Products |
0.4 |
0.3 |
|
Tobacco Products |
0.1 |
0.4 |
|
Textiles |
0.2 |
0.7 |
|
Losers |
Year-on-Year Growth (percent) |
|
|---|---|---|
| July 2016 |
June 2016
(revised)
|
|
|
Petroleum Products |
-11.8 |
-13.1 |
|
Machinery except Electrical |
-16.4 |
-15.4 |
|
Basic Metals |
-4.4 |
-9.6 |
|
Transport Equipment |
-1.6 |
1.2 |
|
Furniture and Fixtures |
-23.1 |
-23.4 |
|
Footwear and Wearing Apparel |
-4.5 |
-2.8 |
|
Rubber and Plastic Products |
-2.0 |
-4.8 |
|
Chemical Products |
-0.9 |
-0.9 |
|
Leather Products |
-5.4 |
-5.1 |
|
Paper and Paper Products |
-0.8 |
0.6 |
|
Wood and Wood Products |
-1.0 |
-1.0 |
|
Printing |
-0.7 |
-0.6 |
|
Gainers |
Month-on-Month Growth (percent) |
|
|---|---|---|
| July 2016 |
June 2016
(revised)
|
|
|
Basic Metals |
0.4 |
0.8 |
|
Fabricated Metal Products |
0.4 |
0.6 |
|
Food Manufacturing |
0.0 |
0.1 |
|
Chemical Products |
0.0 |
-0.8 |
|
Miscellaneous Manufactures |
0.1 |
0.5 |
|
Rubber and Plastic Products |
a/ |
0.2 |
|
Textiles |
a/ |
a/ |
|
Printing |
0.0 |
0.0 |
|
Beverages |
0.0 |
0.0 |
|
Wood and Wood Products |
0.0 |
0.9 |
|
Losers |
Month-on-Month Growth (percent) |
|
|---|---|---|
| July 2016 |
June 2016
(revised)
|
|
|
Tobacco Products |
-0.3 |
0.1 |
|
Leather Products |
-0.2 |
1.8 |
|
Furniture and Fixtures |
-0.4 |
-7.9 |
|
Paper and Paper Products |
-0.3 |
0.1 |
|
Footwear and Wearing Apparel |
-0.4 |
0.4 |
|
Non-Metallic Mineral Products |
-0.4 |
1.0 |
|
Machinery except Electrical |
-0.3 |
0.9 |
|
Transport Equipment |
-1.0 |
0.2 |
|
Petroleum Products |
-2.5 |
-0.5 |
|
Electrical Machinery |
-1.9 |
1.9 |
- Introduction
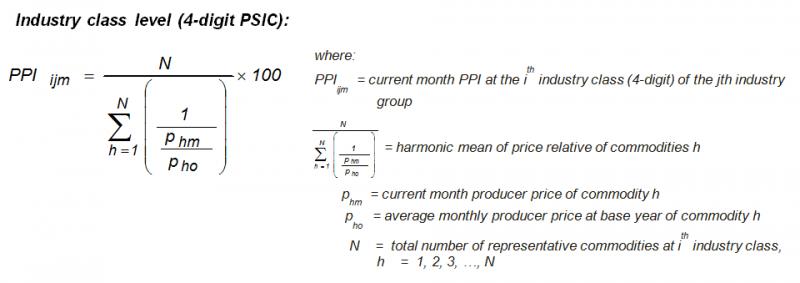
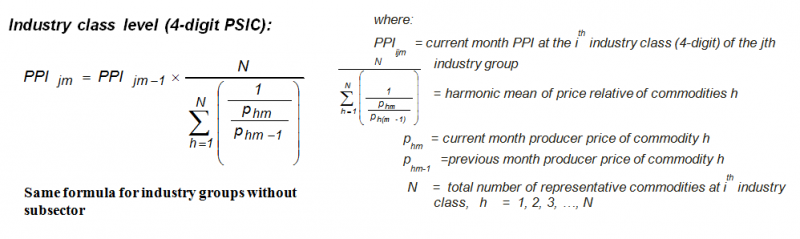
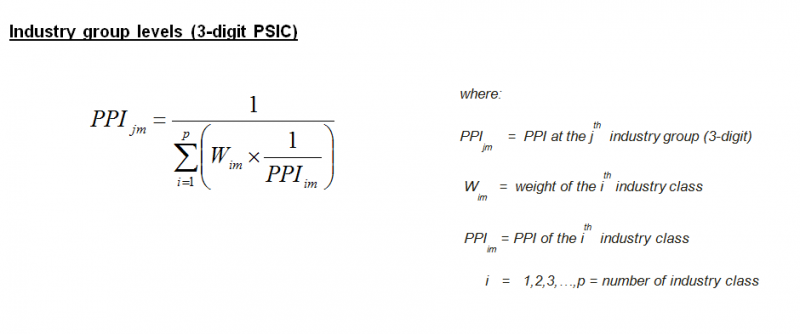
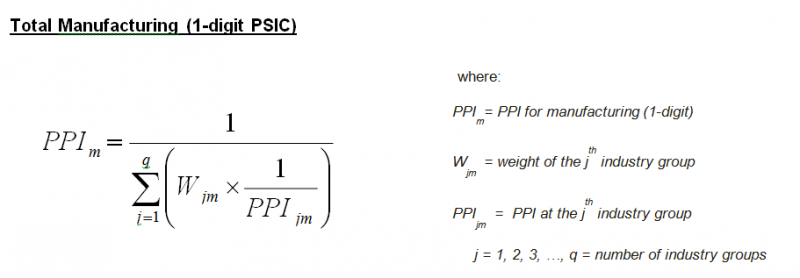
- Method of Index Computation
- Industry Coverage
Starting with January 2013 reference month, the PPI utilizes the 2009 Philippine Standard Industrial Classification (PSIC) to classify sectors and industries. Selected industry classes of the 2009 PSIC were grouped to form the 20 industry groupings of the 2016 PPS. These are presented in the table below.
|
2009 PSIC CODE |
INDUSTRY DESCRIPTION |
|---|---|
|
C10 |
Food manufacturing * |
|
C11 |
Beverages |
|
C12 |
Tobacco products |
|
C13 |
Textiles* |
|
C14,C152 |
Footwear and wearing apparel |
|
C151 |
Leather products |
|
C16 |
Wood and wood products* |
|
C17 |
Paper and paper products |
|
C18 |
Printing and reproduction of recorded media |
|
C19 |
Petroleum products* |
|
C20,C21 |
Chemical products* |
|
C22 |
Rubber and plastic products* |
|
C23 |
Non-metallic mineral products* |
|
C24 |
Basic Metals* |
|
C25 |
Fabricated metal products |
|
C262,C275,C28,C263,C268 |
Machinery except electrical* |
|
C261,C264,C27,C29301 |
Electrical machinery* |
|
C29 except C29301,C30 |
Transport equipment |
|
C31 |
Furniture and fixtures |
|
C265,C266,C267,C32 |
Miscellaneous manufactures |
Note: * - Major sectors categorized into sub-sectors
- Response Rate
The response rate for July 2016 is 81.4 percent, which corresponds to the retrieval of 613 establishments’ reports out of the 753 samples for the survey. Refer to Tables 2 and B.
|
Table B Response Rates For Total Manufacturing
(In Percent)
|
|
|---|---|
|
July 2016 |
June 2016
(revised)
|
|
81.4 |
90.0r |
Missing prices for products of sample establishments are estimated using the short-term geometric mean of the actual prices of responding samples within the same industry class. Revisions to the preliminary estimates are done upon receipt of actual reports from late responding establishments.
| Attachment | Size |
|---|---|
|
|
74.37 KB |
|
|
35.97 KB |