
|
Table A Year-on-Year and Month-on-Month Growth Rates of Producer Price Index:
September 2017, August 2017 and September 2016
|
|||
|---|---|---|---|
|
TOTAL MANUFACTURING |
September
2017
|
August
2017
|
September
2016
|
|
Producer Price Index (2000=100) |
132.4 |
132.7 r |
133.1 |
|
Year-on-Year Growth |
- 0.5 |
- 0.4 |
- 4.4 |
|
Month-on-Month Growth |
- 0.2 |
0.1 |
- 0.1 |
- Producer Price Index post decrements in September 2017
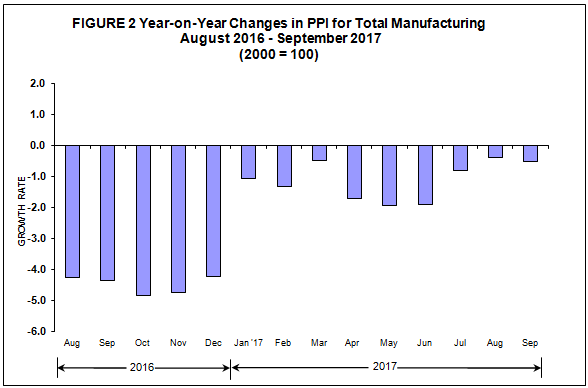
The Producer Price Index (PPI, 2000=100) for manufacturing dropped at a slower rate of 0.5 percent in September 2017 from negative growth of 4.4 percent during the same period of previous year. The decrease may be attributed to the significant decline of three major sectors namely: fabricated metal products (44.3 percent), leather products (16.5 percent) and furniture and fixtures (16.3 percent). Refer to Tables 1 and A-1.
By month, PPI slightly went down by 0.2 percent from previous month’s rate of 0.1 percent with eleven sectors posting a negative growth, led by paper and paper products with negative 2.7 percent. Meanwhile, six sectors posted increases while three sectors reflected flat growth. Refer to Tables 1 and A-2.

|
Gainers |
Year-on-Year Growth (percent) |
|
|---|---|---|
| September 2017 |
August 2017
(revised)
|
|
|
Petroleum Products |
12.8 |
14.8 |
|
Basic Metals |
3.1 |
4.8 |
|
Machinery except Electrical |
2.4 |
-2.8 |
|
Electrical Machinery |
0.8 |
1.3 |
|
Miscellaneous Manufactures |
3.3 |
5.7 |
|
Tobacco Products |
1.9 |
1.9 |
|
Printing |
2.6 |
2.7 |
|
Footwear & Wearing Apparel |
0.5 |
0.8 |
|
Textiles |
0.9 |
1.1 |
|
Wood & Wood Products |
0.1 |
-0.1 |
|
Losers |
Year-on-Year Growth (percent) |
|
|---|---|---|
| September 2017 |
August 2017
(revised)
|
|
|
Fabricated Metal Products |
-44.3 |
-43.4 |
|
Non- Metallic Mineral Products |
-6.2 |
-5.6 |
|
Chemical Products (excludes plastic) |
-2.2 |
-0.8 |
|
Rubber and plastic products |
-3.3 |
-4.1 |
|
Furniture & Fixtures |
-16.3 |
-14.6 |
|
Beverages |
-1.8 |
-1.8 |
|
Food Manufacturing |
-0.3 |
-0.2 |
|
Leather Products |
-16.5 |
-10.6 |
|
Transport Equipment |
-0.4 |
-0.5 |
|
Paper & Paper Products |
-1.7 |
0.9 |
|
Gainers |
Month-on-Month Growth (percent) |
|
|---|---|---|
| September 2017 |
August 2017
(revised)
|
|
|
Transport Equipment |
0.4 |
-1.0 |
|
Electrical Machinery |
a/ |
0.4 |
|
Footwear & Wearing Apparel |
0.6 |
0.7 |
|
Machinery except Electrical |
a/ |
0.2 |
|
Rubber and plastic products |
a/ |
-0.1 |
|
Non- Metallic Mineral Products |
a/ |
1.3 |
|
Wood & Wood Products |
0.0 |
0.4 |
|
Tobacco Products |
0.0 |
0.0 |
|
Beverages |
0.0 |
-0.2 |
|
Losers |
Month-on-Month Growth (percent) |
|
|---|---|---|
| September 2017 |
August 2017
(revised)
|
|
|
Petroleum Products |
-1.2 |
2.3 |
|
Chemical Products (excludes plastic) |
-1.1 |
0.5 |
|
Basic Metals |
-0.9 |
1.2 |
|
Paper & Paper Products |
-2.7 |
2.0 |
|
Food Manufacturing |
-0.2 |
-0.3 |
|
Fabricated Metal Products |
-0.1 |
-5.5 |
|
Furniture & Fixtures |
-0.3 |
0.8 |
|
Miscellaneous Manufactures |
-0.1 |
0.7 |
|
Printing |
b/ |
a/ |
|
Textiles |
b/ |
a/ |
|
Leather Products |
b/ |
0.3 |
- Response Rate
The response rate for September 2017 is 77.5 percent, which corresponds to the retrieval of 582 establishments’ reports out of the 751 samples for the survey. Refer to Tables 2 and B..
|
Table B Response Rates For Total Manufacturing
(In Percent)
|
|
|---|---|
|
September 2017 |
August 2017
(revised)
|
|
77.5
|
90.7r
|
Missing prices for products of sample establishments are estimated using the short-term geometric mean of the actual prices of responding samples within the same industry class. Revisions to the preliminary estimates are done upon receipt of actual reports from late responding establishments.
- Introduction
- Method of Index Computation
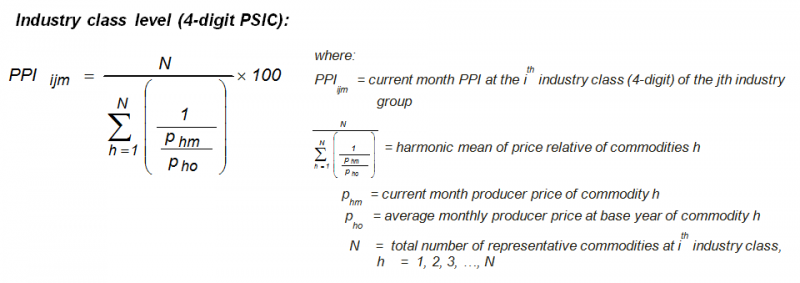

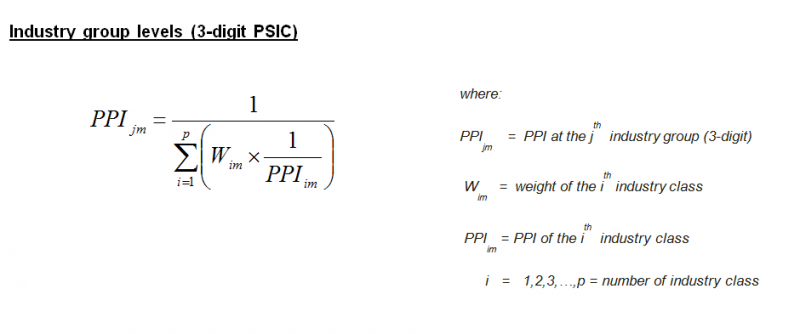
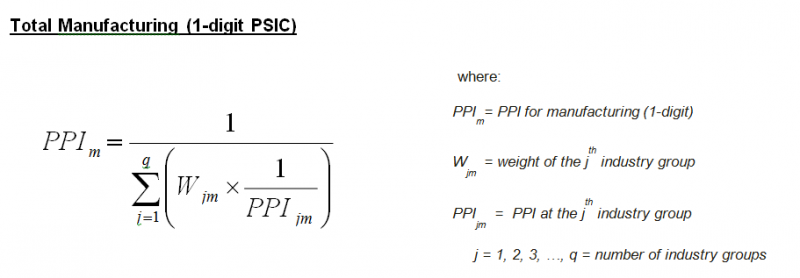
Starting with January 2017 PPI, a link factor was used to adjust weight effects and measure the correct price change. The weights are adjusted using the 2013 ASPBI.
- Industry Coverage
Starting with January 2013 reference month, the PPI utilizes the 2009 Philippine Standard Industrial Classification (PSIC) to classify sectors and industries. Selected industry classes of the 2009 PSIC were grouped to form the 20 industry groupings of the 2017 PPS. These are presented in the table below.
|
2009 PSIC CODE |
INDUSTRY DESCRIPTION |
|---|---|
|
C10 |
Food manufacturing * |
|
C11 |
Beverages |
|
C12 |
Tobacco products |
|
C13 |
Textiles* |
|
C14,C152 |
Footwear and wearing apparel |
|
C151 |
Leather products |
|
C16 |
Wood and wood products* |
|
C17 |
Paper and paper products |
|
C18 |
Printing and reproduction of recorded media |
|
C19 |
Petroleum products* |
|
C20,C21 |
Chemical products* |
|
C22 |
Rubber and plastic products* |
|
C23 |
Non-metallic mineral products* |
|
C24 |
Basic Metals* |
|
C25 |
Fabricated metal products |
|
C262,C275,C28,C263,C268 |
Machinery except electrical* |
|
C261,C264,C27,C29301 |
Electrical machinery* |
|
C29 except C29301,C30 |
Transport equipment |
|
C31 |
Furniture and fixtures |
|
C265,C266,C267,C32 |
Miscellaneous manufactures |
Note: * - Major sectors categorized into sub-sectors
| Attachment | Size |
|---|---|
|
|
54.26 KB |
|
|
14.39 KB |