
Year-on-Year
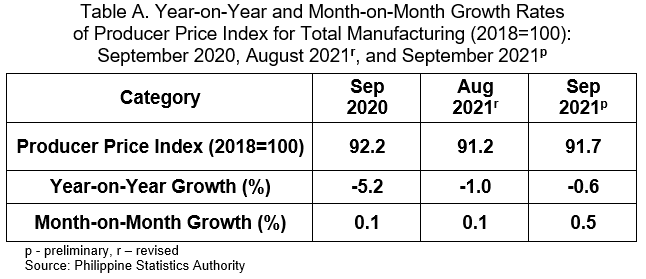
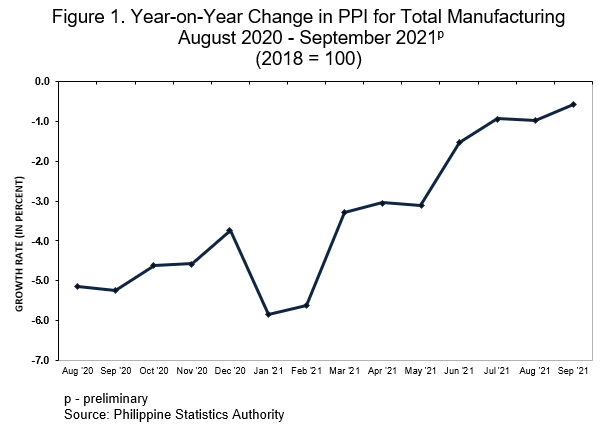
The Producer Price Index (PPI) for manufacturing continued to contract at an annual rate of -0.6 percent in September 2021. This decline was slower than the -1.0 percent annual rate in August 2021. In September 2020, the PPI posted a faster drop of -5.2 percent. (Table A)
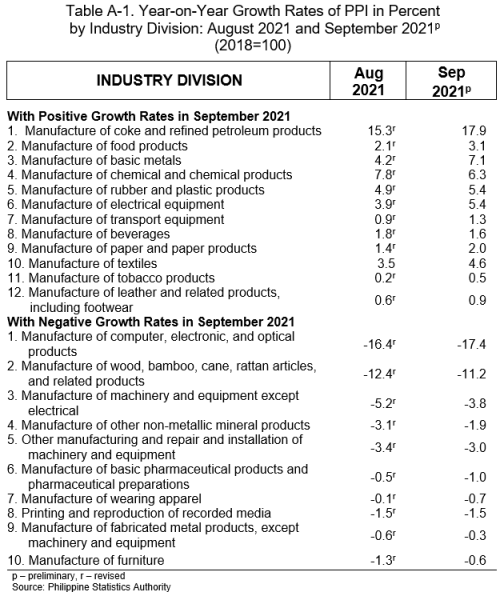
The decline in the PPI in September 2021 can be attributed to the annual decreases in the indices of 10 industry divisions led by manufacture of computer, electronic and optical products which posted a double-digit annual decrement of -17.4 percent.
On the other hand, 12 industry divisions recorded positive annual growth rates which was led by manufacture of coke and refined petroleum products with an annual increase of 17.9 percent. This heavily weighted industry division continuously registered an annual increase since March 2021. In addition, manufacture of food products (3.1%), consistently posted positive growths since May 2021. (Tables A-1 and 1)
Month-on-Month
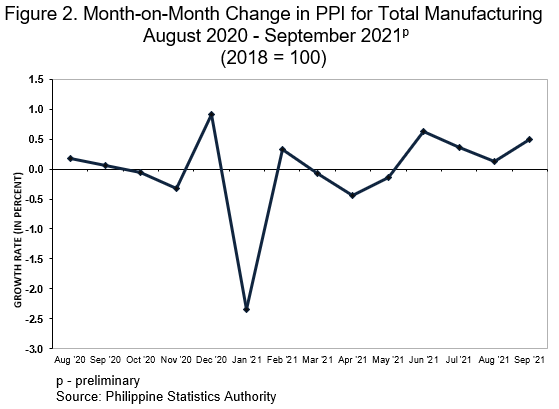
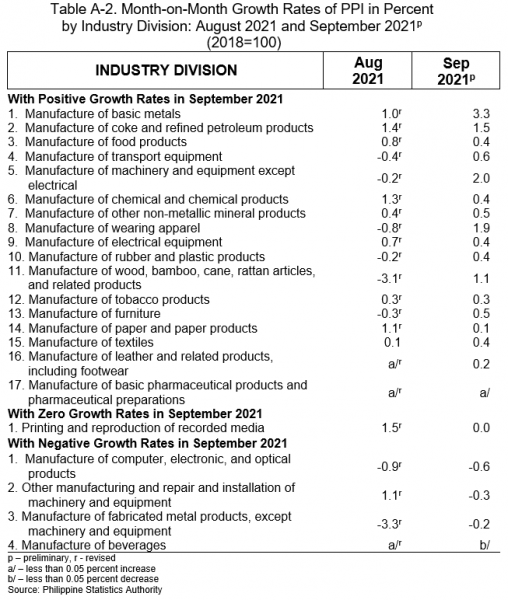
Month-on-month, the PPI for manufacturing posted an increment with a monthly growth rate of 0.5 percent in September 2021, following an increase of 0.1 percent in August 2021. In September 2020, the PPI also posted a monthly increase of 0.1 percent. (Table A)
Seventeen industry divisions recorded positive monthly growth rates in September 2021 led by manufacture of basic metals with monthly increment of 3.3 percent. On the contrary, the PPI of four industry divisions recorded monthly decrements, with manufacture of computer, electronic and optical products posting the highest monthly drop of -0.6 percent. Furthermore, the monthly growth rate of printing and reproduction of recorded media was at 0.0 percent. (Tables A-2 and 1)
DENNIS S. MAPA, Ph.D.
Undersecretary
National Statistician and Civil Registrar General
- Introduction
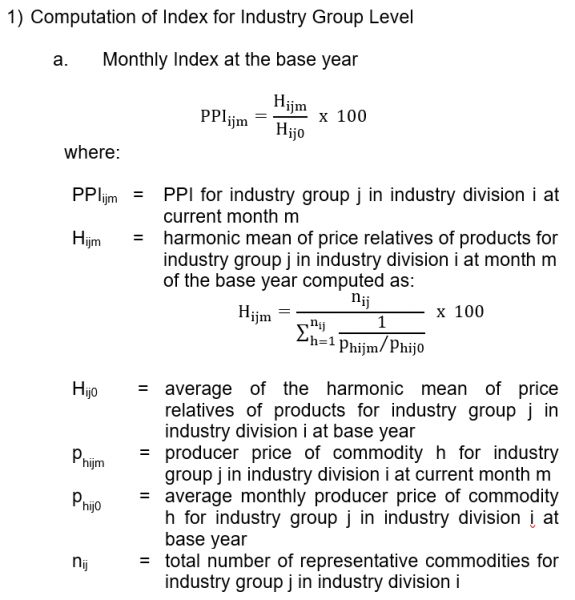
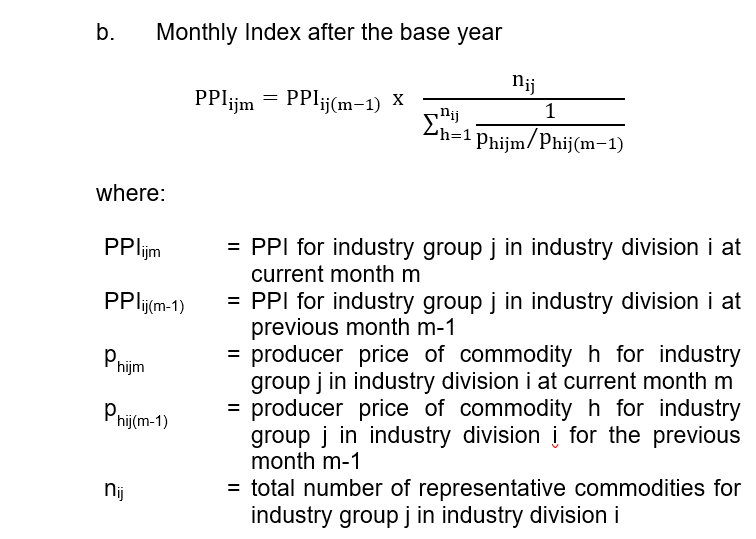
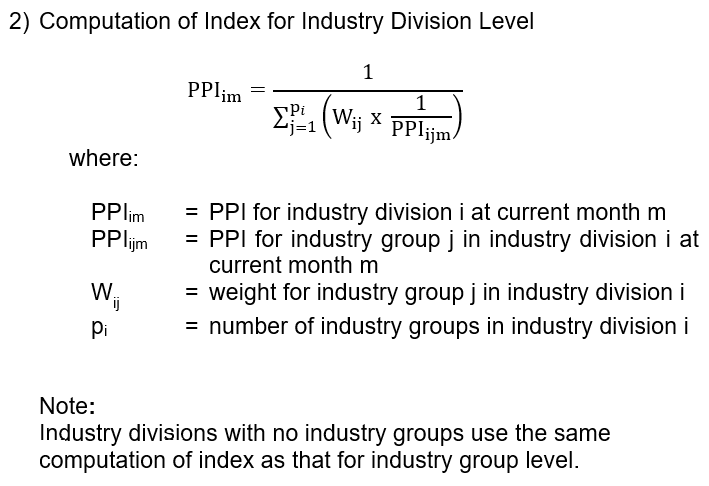
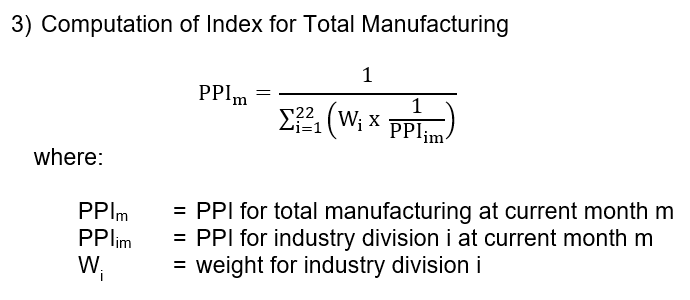
- Method of Index Computation
- Computation of Growth Rates
Year-on-year growth rates are computed by dividing the current month’s index by the index of the same month of the previous year less 1.
Month-on-month growth rates are computed by dividing the current month’s index by the previous month’s index less 1.
- Imputation and Revision
Imputation is done for sample establishments that are in operation during the reference period but with no received response during the release date. Results are revised accordingly when the actual data are received and these revisions are reflected in the next release.
- Industry Coverage
Starting with the January 2013 reference month, PPI utilizes the 2009 Philippine Standard Industrial Classification (PSIC) to classify sectors and industries. Selected industry groups of the 2009 PSIC were grouped to form the 22 industry divisions of the 2021 PPS. These are presented in the table below.
|
2009 PSIC CODE |
INDUSTRY DESCRIPTION |
|---|---|
|
C10 |
Manufacture of food products * |
|
C11 |
Manufacture of beverages |
|
C12 |
Manufacture of tobacco products |
|
C13 |
Manufacture of Textiles |
|
C14 |
Manufacture of wearing apparel |
|
C15 |
Manufacture of leather and related products, including footwear |
|
C16 |
Manufacture of wood, bamboo, cane, rattan articles, and related products products* |
|
C17 |
Manufacture of paper and paper products |
|
C18 |
Printing and reproduction of recorded media |
|
C19 |
Manufacture of coke and refined petroleum products |
|
C20 |
Manufacture of chemical and chemical products* |
|
C21 |
Manufacture of basic pharmaceutical products and pharmaceutical preparations |
|
C22 |
Manufacture of rubber and plastic products* |
|
C23 |
Manufacture of other non-metallic mineral products* |
|
C24 |
Manufacture of basic metals* |
|
C25 |
Manufacture of fabricated metal products, except machinery and equipment* |
|
C26 |
Manufacture of computer, electronic, and optical products* |
|
C27 |
Manufacture of electrical equipment* |
|
C28 |
Manufacture of machinery and equipment except electrical* |
|
C29, C30 |
Manufacture of transport equipment* |
| C31 | Manufacture of furniture |
| C32, C33 | Other manufacturing |
* Industry divisions categorized further into industry groups
See more at the Producer Price Survey (PPS) main page.