PRODUCTION
Value of Production Index decelerates at a slower pace
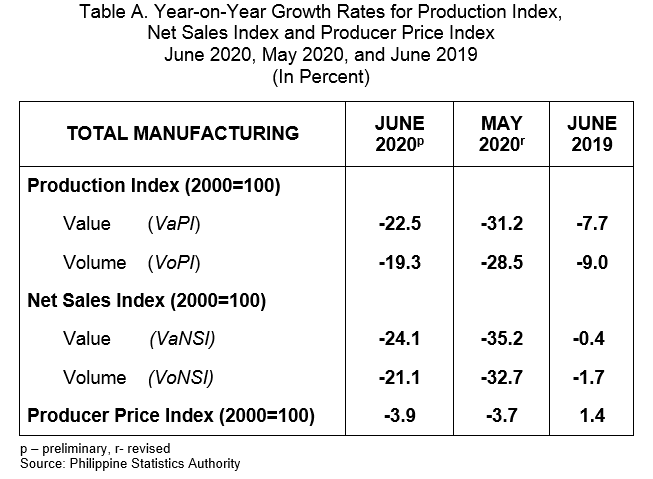
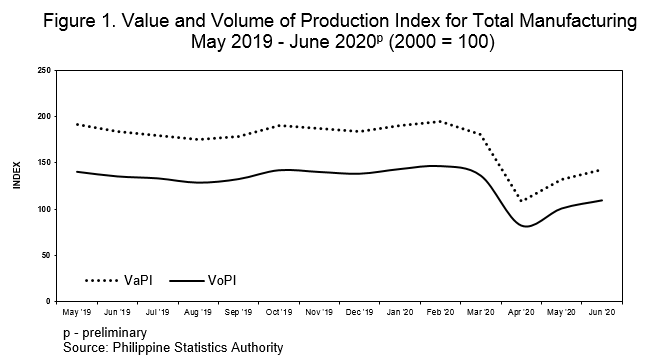
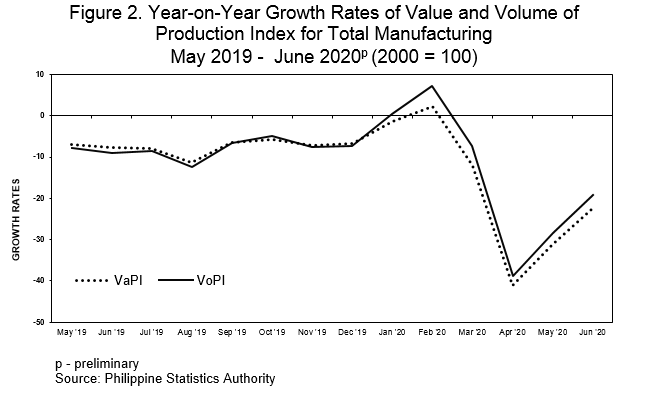
The Value of Production Index (VaPI) for Manufacturing sector contracted at a slower rate of 22.5 percent in June 2020 compared to the 31.2 percent decrease in May 2020. VaPI dropped for the fourth month in a row this June 2020 but showing gradual recovery as it hit its second month with a slower annual decline. In June 2019, VaPI shrank at a much gradual rate of 7.7 percent. (Table A)
Contributory to the slower decline of VaPI in June 2020 were the improvements for petroleum products and wood and wood products with annual increases of 6.7 percent and 2.4 percent, respectively. Prior to the rebound, VaPI had negative growth for 17 consecutive months for petroleum products, and 7 months of negative growth for wood and wood products. Further tapering off the annual decline in VaPI for manufacturing were the slower annual drops in the indices of 16 of the 18 remaining industry groups. (Tables 1-A and 1)
Volume of Production Index likewise drops at a slower rate
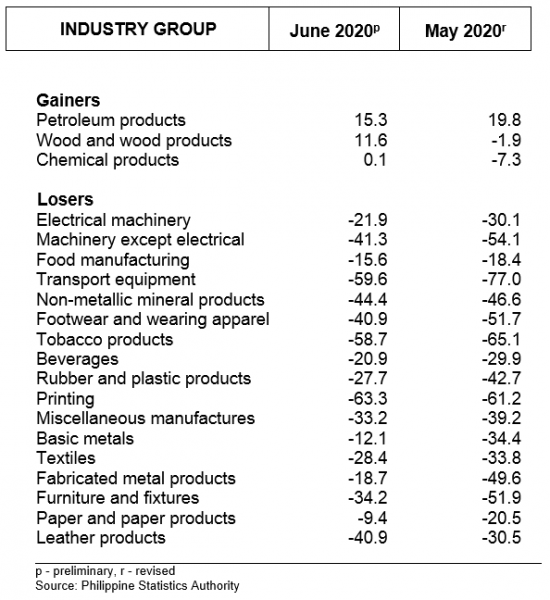
The Volume of Production Index (VoPI) in June 2020 likewise shrank by 19.3 percent year-on-year but the decline was slower compared to the previous month’s drop of 28.5 percent. In May 2019, the annual decrease was observed at 9.0 percent. (Table A)
Of the industry groups, positive growths were seen in petroleum products (15.3 %), wood and wood products (11.6 %), and chemical products (0.1%) in June 2020. Before regaining this period, VoPI for wood and wood products had negative growth for five (5) consecutive months, and chemical products had negative growth for two (2) consecutive months.
VoPI for the rest of the commodity groups were on downtrend, 15 of which had slower decline while two exhibited faster drops. (Tables 1-B and 2)
NET SALES
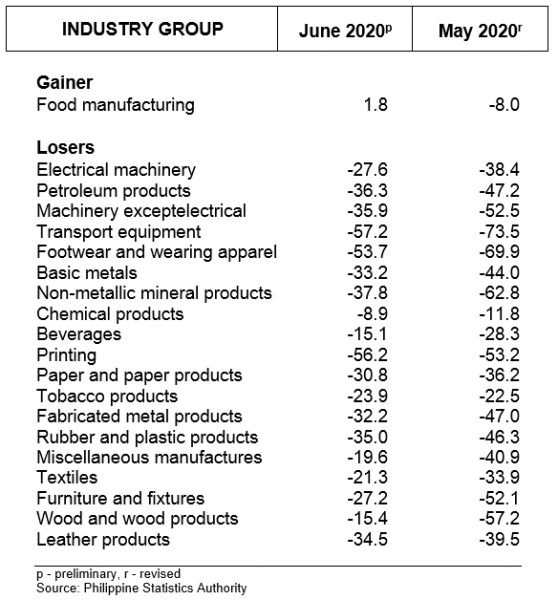
Value of Net Sales Index for food manufacturing rebounds
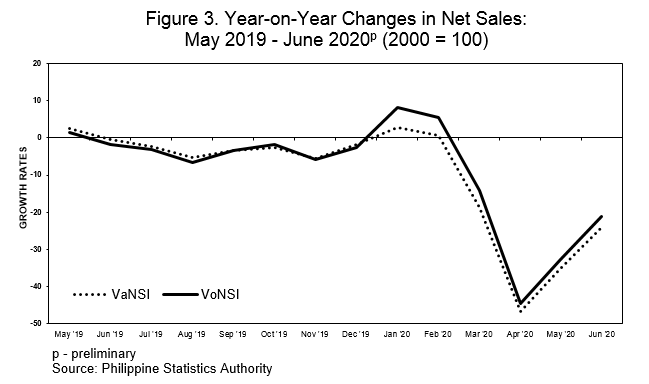
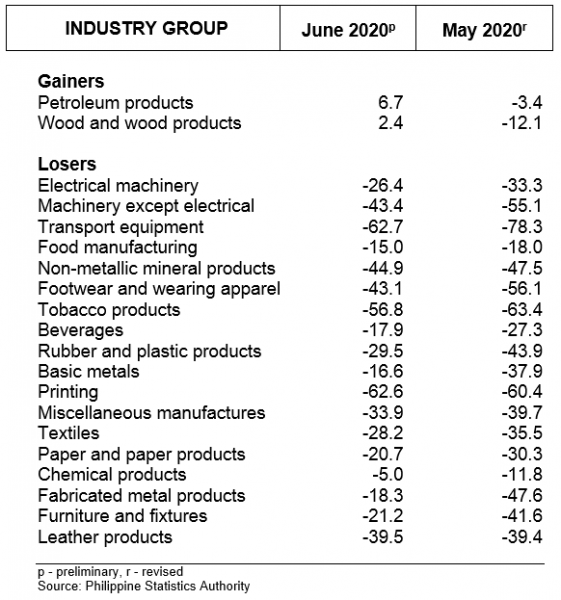
In terms of sales for manufacturing sector, as reflected in the Value of Net Sales Index (VaNSI) for June 2020, it dropped to a slower annual rate of 24.1 percent from a decline of 35.2 percent in May 2020. The June 2020 figure was the fourth consecutive month that VaNSI had a negative growth, and the second successive month that it was declining at a slower rate. (Table A)
Contributing to the slower decline of VaNSI in the period was the positive annual growth in food manufacturing at 1.8 percent from -8.0 percent in the previous month.
The rest of the commodity groups exhibited downtrend, however, majority (17) were on a slower rate of decline. (Tables 2-A and 3)
Volume of Net Sales Index remains at double-digit decline but at a slower rate
The Volume of Net Sales Index (VoNSI) posted a year-on-year decrement of 21.1 percent in June 2020 from 32.7 percent decline in the previous month. In June 2019, VoNSI dropped by 1.7 percent. (Table A)
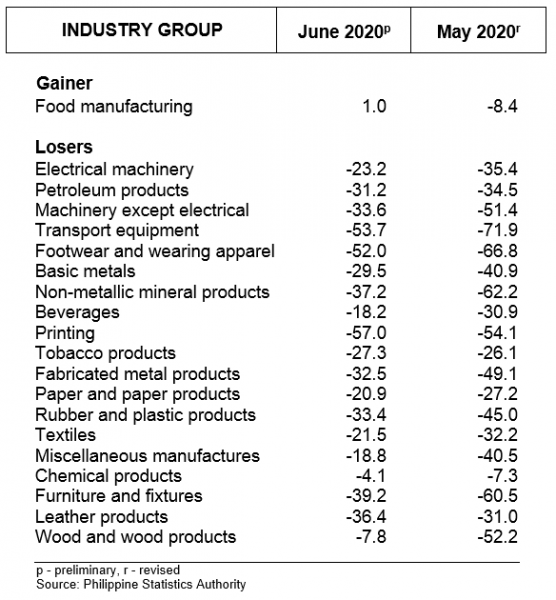
The recovery observed for food manufacturing to an annual growth of 1.0 percent in June 2020 from -8.4 percent a month ago contributed to the slow down in the decline of the index for volume of sales for the manufacturing sector.
Contributing further to the narrower decline in VoNSI for manufacturing sector in the period were the slower reductions in the indices of 16 industry groups. (Tables 2-B and 4)
CAPACITY UTILIZATION
Average Capacity Utilization Rate for manufacturing inches up
Based on responding establishments with responses on capacity utilization, average capacity utilization rate for manufacturing sector in June 2020 inched up to 73.0 percent from 72.4 percent in the previous month.
Three of the 20 industry groups had at least 80 percent average capacity utilization rate which was led by textiles (81.6%), followed by furniture and fixtures (81.2%), and rubber and plastic products (80.7%). (Table 6)
One-fifth of total responding manufacturing establishments operate at full capacity
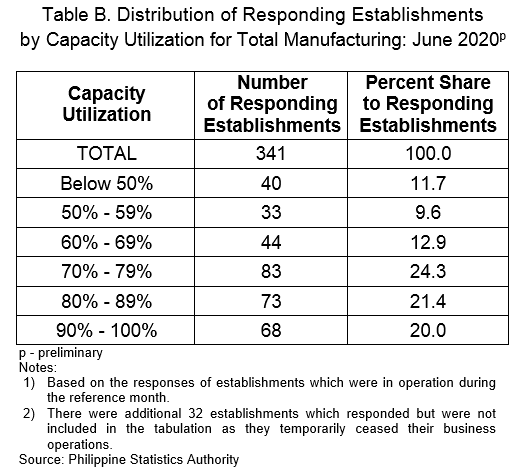
The proportion of establishments that operated at full capacity (90% to 100%) was about one-fifth (20.0%) of the total number of responding establishments with responses on capacity utilization. More than two-fifths (45.7%) operated at 70 to 89 percent capacity while more than one-third (34.3%) operated below 70 percent capacity. (Table B)
(Sgd.) DENNIS S. MAPA, Ph. D.
Undersecretary
National Statistician and Civil Registrar General
by Industry Group
May and June 2020
(2000 = 100)
by Industry Group
May and June 2020
(2000 = 100)
by Industry Group
May and June 2020
(2000 = 100)
by Industry Group
May and June 2020
(2000 = 100)