
Year-on-Year Inflation Rates, All Items | |||
| August | July | Year-to-date | |
| Philippines | |||
| Headline | 6.3 | 6.4 | 6.9 |
| Core | 5.3 | 5.4 | 5.9 |
| NCR | |||
| Headline | 6.9 | 7.1 | 7.7 |
| AONCR | |||
| Headline | 6.0 | 6.0 | 6.5 |
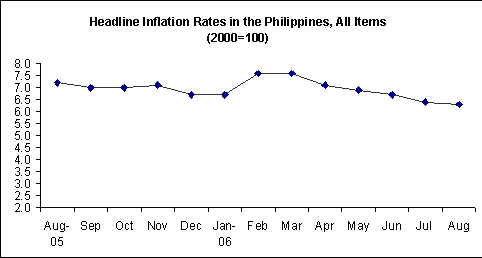
The year-on-year headline inflation rate in the Philippines further slowed down to 6.3 percent in August from 6.4 percent in July mainly brought about by the slower annual price movement of fuel, light and water (FLW). Moreover, lower inflation rates in services and miscellaneous items also contributed to the downward trend. Inflation a year ago was 7.2 percent.
Excluding selected food and energy items, core inflation continued to decelerate at 5.3 percent in August from 5.4 percent in July.
Slowdowns in the annual inflation rates in all the commodity groups except for food, beverages and tobacco (FBT) pushed down the year-on-year inflation in the National Capital Region (NCR) to 6.9 percent in August from 7.1 percent in July.
Inflation rate in Areas Outside the National Capital Region (AONCR) was 6.0 percent in August, similar to the inflation in July.
Month-on-Month Inflation Rates, All Items | ||
| August | July | |
| Philippines | 0.4 | 0.5 |
| NCR | 0.1 | 0.8 |
| AONCR | 0.5 | 0.4 |
Measured from a month ago, the general level of consumer prices eased to 0.4 percent in August from 0.5 percent in July due to the 1.0 percent drop in the FLW index. The downward adjustments in the electricity rates in NCR and in selected regions resulted to a slowdown in the group’s index. Reductions in the prices of selected petroleum products in many regions including NCR particularly during the latter part of the month also contributed to the slower movement of the overall monthly inflation rate.
CONSUMER PRICE INDEX
(2000=100)
AUGUST 2006
l By Region, Year-on-Year
The inflation rate in NCR further decelerated to 6.9 percent in August from 7.1 percent in July.
Inflation in AONCR moved at its previous month’s rate of 6.4 percent. Higher annual inflation rates registered in ten regions were offsetted by the lower rates recorded in the other regions. The biggest increment of 0.6 percentage point was seen in Ilocos (6.6% from 6.0%) and Central Luzon (6.7% from 6.1%). ARMM continued to post the highest inflation rate of 8.8 percent while the lowest was still noticed in Western Visayas at 4.3 percent.
l By Commodity Group, Year-on-Year
Inflation rate in FLW eased to 13.0 percent in August from 14.5 percent in July; services, 9.0 percent from 9.4 percent; and miscellaneous items, 3.0 percent from 3.1 percent. On the other hand, inflation for FBT was higher at 5.6 percent from 5.2 percent while those for clothing and H&R remained at their corresponding last month’s rates of 3.1 percent and 3.8 percent.
The inflation rate for food alone in the Philippines went up to 5.5 percent in August from 5.2 percent in July.
Faster annual price adjustment was recorded in corn at 5.1 percent in August from 2.5 percent in July; dairy products, 6.0 percent from 5.9 percent; eggs, 5.9 percent from 4.3 percent; fish, 6.3 percent from 5.4 percent; fruits and vegetables, 11.6 percent from 9.9 percent; and meat, 2.2 percent from 1.5 percent. Meanwhile, annual price additions in rice and cereal preparations were correspondingly slower at 1.9 percent and 5.7 percent from 2.7 percent and 5.8 percent, respectively. Inflation for miscellaneous foods remained at 7.8 percent.
In NCR, except for FBT whose annual inflation rate was higher at 6.5 percent in August from 5.3 percent in July, inflation for all the commodity groups decelerated. The annual rate of price movement in clothing slowed to 2.5 percent from 2.7 percent; H&R, 4.1 percent from 4.3 percent; FLW, 11.2 percent from 17.2 percent; services, 10.3 percent from 10.4 percent; and miscellaneous items, 2.7 percent from 2.9 percent.
The inflation rate for food alone in NCR accelerated to 6.6 percent in August from 5.3 percent in July.
The annual price hike was faster in rice at 1.0 percent in August from 0.7 percent in July; dairy products, 6.6 percent from 6.4 percent; eggs, 11.5 percent from 4.9 percent; fish, 6.0 percent from 3.2 percent; fruits and vegetables, 15.7 percent from 10.5 percent; and meat, 2.8 percent from 1.3 percent. On the contrary, annual price gains respectively improved in cereal preparations and miscellaneous foods at 6.3 percent and 8.1 percent from their corresponding rates of 6.6 percent and 8.2 percent. An annual price reduction was recorded in corn at -0.4 percent from 1.4 percent.
In AONCR, upward movements of clothing, services and miscellaneous items correspondingly slipped to 3.2 percent, 8.2 percent and 3.1 percent in August from their respective July rates of 3.3 percent, 8.8 percent and 3.2 percent. Meanwhile, annual price additions were higher in H&R, (3.6% from 3.4%) and FLW items (14.0% from 13.0%). Inflation for FBT was still registered at 5.3 percent.
Inflation for food alone in AONCR continued to slow down at 5.2 percent in August from 5.3 percent in July.
The annual price increment in rice eased to 2.1 percent in August from 3.0 percent in July. Slower or negative growth rates were posted in all the regions except for Central Luzon, CALABARZON and Northern Mindanao. The biggest decline of 3.0 percentage points (-0.5% from 2.5%) was observed in MIMAROPA. Lower annual growth rates were also seen in cereal preparations and miscellaneous foods at 5.4 percent and 7.6 percent in August from corresponding rates of 5.5 percent and 7.7 percent in July. On the other hand, higher annual price gain was noticed in corn at 5.3 percent from 2.6 percent; dairy products, 5.8 percent from 5.7 percent; eggs, 4.3 percent from 4.1 percent; fish, 6.3 percent from 5.9 percent; fruits and vegetables, 10.4 percent from 9.6 percent; and meat, 1.9 percent from 1.6 percent.
l By Region, Month-on-Month
Price additions in NCR further slackened to 0.1 percent in August from 0.8 percent in July as prices of FLW items dropped by -4.7 percent from 3.2 percent. Moreover, price increases in services items was slower at 0.5 percent from 0.8 percent. On the other hand, prices of FBT and HR items correspondingly inched up to 1.2 percent and 0.2 percent from 0.8 percent and zero growth, respectively. Prices of clothing and miscellaneous items remained stable as their indices recorded a zero growth.
Consumer prices in AONCR generally climbed up by 0.5 percent in August from 0.4 percent in July as prices of FBT items gained by 0.6 percent from 0.2 percent. However, price additions in FLW and services items were correspondingly slower at 1.2 percent and 0.3 percent from 1.4 percent and 0.5 percent, respectively. Price hikes in clothing and miscellaneous items remained at 0.2 percent and H&R items, 0.4 percent. The highest month-on-month rate at 1.1 percent was noted in Ilocos while CAR, Central Visayas, SOCCSKSARGEN and Caraga posted the lowest rate at 0.2 percent.
l By Commodity Group, Month-on-Month
Measured from a month ago, prices at the national level moved at a slower pace of 0.4 percent in August from 0.5 percent in July. This can be attributed to the 1.0 percent reduction in the prices of FLW items from a 2.1 percent growth last month. Price increases of services items also slipped to 0.4 percent from 0.7 percent. However, higher price increments were registered in FBT items (0.8% from 0.3%) and H&R items (0.3% from 0.2%). Month-on-month inflation in clothing and miscellaneous items was still at 0.2 percent.
Prices of vegetables went up as the monsoon rains during the month affected the deliveries of vegetables in the markets. Prices of selected fresh fruits were also pegged higher this month. Thus, the index of fruits and vegetables in the three areas moved upward: Philippines, 3.6 percent from 0.8 percent; NCR, 7.7 percent from 3.3 percent; and AONCR, 2.3 percent from 0.1 percent.
The continued increments in the price of chicken in many regions including NCR mainly pushed up the meat index in the Philippines by 0.7 percent from 0.4 percent; NCR, 1.1 percent from 1.0 percent; and AONCR, 0.5 percent from 0.1 percent. Higher prices of beef and processed meat in selected regions also contributed to the uptrend.
Add-ons in the prices of cooking oil, coffee, sugar, salt and sauces were observed in selected regions during the month. Increased prices of meals eaten outside the home were also noted in some regions. These factors raised the miscellaneous foods index in the Philippines and AONCR by 0.4 percent from 0.1 percent. Meanwhile, the index in NCR inched up by 0.1 percent, same rate last month as uptick in the prices of cooking oil, coffee, salt and sauces were recorded.
Higher prices of fresh and processed eggs caused the group’s index in the Philippines to climb by 2.2 percent from 0.2 percent; NCR, 7.5 percent from 1.1 percent; and AONCR, 0.6 percent from -0.1 percent.
The abundant supply of shrimps, crabs, shells and mollusks in the wet markets in NCR lowered the fish index in the area by -0.3 percent in August from 1.0 percent last month. In AONCR, the stormy weather conditions experienced during the month limited the supply of fish species in the markets. Thus, the fish index in the area grew by 0.6 percent from 0.4 percent. Overall, the national index moved up at 0.4 percent from 0.5 percent. The lean month of August brought up prices of rice in the three areas by 0.2 percent.
The recent price rollbacks in gasoline and diesel caused the services index in the Philippines to move at a slower pace of 0.4 percent from 0.7 percent; NCR, 0.5 percent from 0.8 percent; and AONCR, 0.3 percent from 0.5 percent.
Price add-ons in selected construction materials in many regions including NCR and higher rental rates in some regions effected a 0.3 percent uptick in the H&R index for the Philippines, 0.2 percent for NCR and 0.4 percent for AONCR.
Lower generation charge for electricity in NCR brought down the respective FLW indices in the area and in the Philippines by -1.0 percent and -4.7 percent from their corresponding July rates of 3.2 percent and 2.1 percent. In AONCR, higher price of LPG in all the regions raised its FLW index by 1.2 percent, slower than the 1.4 percent growth last month.
NOTE: CPIs and inflation rates by province and selected city are also available upon request at NSO, Industry and Trade Statistics Department, Economic Indices and Indicators Division (Telephone Numbers: 716-39-35 and 715-33-47, email address: r.staana@census.gov.ph).