
APRIL AND MARCH 2014
| Year-on-Year Inflation Rates, All Items | |||
|---|---|---|---|
| April | March | Year-to-date | |
| Philippines | |||
| Headline | 4.1 | 3.9 | 4.1 |
| Core | 2.9 | 2.8 | 3.0 |
| NCR | |||
| Headline | 3.3 | 2.9 | 2.9 |
| AONCR | |||
| Headline | 4.3 | 4.2 | 4.4 |
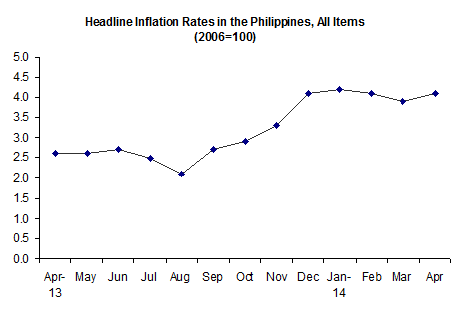
The year-on-year changes in headline inflation at the national level were posted at 4.1 percent in April and 3.9 percent in March primarily due to higher annual increment posted in the heavily-weighted food and non-alcoholic beverages index. Increases were also registered in the indices of housing, water, electricity, gas and other fuels and transport. Inflation a year ago was 2.6 percent.
Excluding selected food and energy items, year-on-year changes in core inflation were recorded 2.9 percent in April and 2.8 percent in March.
Annual year-on-year inflation in the National Capital Region (NCR) likewise advanced to 3.3 percent in April and 2.9 percent in March. Higher annual growths were seen in the indices of housing, water, electricity, gas and other fuels; furnishing, household equipment and routine maintenance of the house; transport; recreation and culture; and restaurant and miscellaneous goods and services.
In Areas Outside NCR (AONCR), year-on-year annual inflation inched up to 4.3 percent in April and 4.2 percent in March as food and non-alcoholic beverages and transport indices recorded higher annual gains.
| Year-on-Year Inflation Rates in the Philippines, All Items January 2009 - April 2014 (2006=100) | ||||||
|---|---|---|---|---|---|---|
| Month | Year | |||||
| 2009 | 2010 | 2011 | 2012 | 2013 | 2014 | |
| January | 7.1 | 3.9 | 4.0 | 4.0 | 3.1 | 4.2 |
| February | 7.2 | 3.9 | 4.7 | 2.7 | 3.4 | 4.1 |
| March | 6.7 | 3.9 | 4.9 | 2.6 | 3.2 | 3.9 |
| April | 5.6 | 4.0 | 4.7 | 3.0 | 2.6 | 4.1 |
| May | 4.3 | 3.9 | 4.9 | 3.0 | 2.6 | |
| June | 3.2 | 3.6 | 5.2 | 2.9 | 2.7 | |
| July | 2.2 | 3.7 | 4.9 | 3.2 | 2.5 | |
| August | 1.7 | 4.1 | 4.6 | 3.8 | 2.1 | |
| September | 2.3 | 3.8 | 4.7 | 3.7 | 2.7 | |
| October | 2.9 | 3.3 | 5.2 | 3.2 | 2.9 | |
| November | 3.5 | 3.7 | 4.7 | 2.8 | 3.3 | |
| December | 4.4 | 3.6 | 4.2 | 3.0 | 4.1 | |
| Average | 4.2 | 3.8 | 4.6 | 3.2 | 3.0 | |
| Month-on-Month Inflation Rates, All Items (2006=100) | ||
|---|---|---|
| Apr | Mar | |
| Philippines | 0.4 | - 0.1 |
| NCR | 0.5 | - 0.1 |
| AONCR | 0.4 | - 0.1 |
-
Consumer prices at the national level rose 0.4 percent in April and a decline of 0.1 percent in March. This was mainly brought about by the upward price adjustments in the heavily-weighted food items particularly rice, meat, fruits, spices, milk and cheese. Also contributing to the uptrend were higher charges in electricity rates and increased prices of some meals eaten outside the home, selected items for personal care and effects, clothing and footwear items.
CONSUMER PRICE INDEX
(2006=100)APRIL 2014
By Region, Year-on-Year
-
Annual inflation in NCR grew by 3.3 percent in April and 2.9 percent in March.
-
Year-on-year mark-up in AONCR likewise went up 4.3 percent in April and 4.2 percent in March. Ten regions posted higher annual upticks with the highest annual rate of 7.2 percent still noted in Eastern Visayas. Meanwhile, the lowest annual inflation of 2.7 percent remained in CAR.
By Commodity Group, Year-on-Year
-
The country’s annual inflation in food and non-alcoholic beverages index continued to go up as it was pegged at 6.2 percent in April and 5.8 percent in March; housing, water, electricity, gas and other fuels index, 3.0 percent and 2.7 percent; and transport index, 1.3 percent and 1.0 percent. The rest of the commodity groups either had slower annual gains or retained their last month’s rate.
A faster annual rate of 6.5 percent in April was registered in the food alone index at the national level and 6.0 percent in March.
Except in fruit and vegetable indices, all the food groups had higher annual growths. The annual increase in the fruit index remained at 5.8 percent while that for the vegetable index further slowed down to 8.2 percent and 8.7 percent.
-
In NCR, the annual movement in housing, water, electricity, gas and other fuels index picked up 2.5 percent in April and 1.2 percent in March; furnishing, household equipment and routine maintenance of the house index, 3.1 percent and 2.9 percent; transport index, 1.9 percent and 1.3 percent; recreation and culture index, 2.5 percent and 2.4 percent; and restaurant and miscellaneous goods and services index, 1.3 percent and 0.8 percent. Those for the rest of the commodity groups either decelerated or remained at their last month’s rates.
-
The food alone index in NCR went up to 5.7 percent in April and 5.6 percent in March.
-
A double-digit annual hike was noted in food products not elsewhere classified index at 10.5 percent in April and 5.4 percent in March. In addition, the annual change in the meat index was higher at 3.1 percent and 2.5 percent; fish index, 7.7 percent and 7.1 percent and milk, cheese and egg index, 3.3 percent and 2.8 percent; fruit index, 0.8 percent and 0.4 percent; vegetable index, 5.3 percent and 4.7 percent; and sugar, jam, honey, chocolate and confectionery index, 1.4 percent and 1.1 percent.
-
The rice index still had a double-digit annual mark-up of 13.5 percent in April, but lower than the 16.3 percent growth last month. Slower or negative annual adjustments were registered in the rest of the food groups.
-
- In AONCR, the annual inflation for food and non-alcoholic beverages index escalated to 6.3 percent in April and 5.9 percent in March and transport index, 1.2 percent and 0.9 percent. Annual movements in other commodity groups either slowed down or remained at their last month’s rate.
-
The annual growth in the food alone index in AONCR jumped to 6.6 percent in April and 6.1 percent in March.
-
Annual adjustment in the rice index further climbed to 12.0 percent in April and 11.2 percent in March. Except in Cagayan Valley and Davao, all the regions had higher annual upticks with the biggest jump of 2.1 percentage points recorded in Central Luzon (14.3% and 12.2%). Twelve regions registered double-digit rates.
-
All the other food groups had higher annual gains except for fruit and vegetable indices whose rates were correspondingly slower at 7.0 percent and 8.7 percent. In March, it was 7.2 percent and 9.4 percent, respectively.
-
By Region, Month-on-Month
The month-on-month inflation in NCR advanced 0.5 percent in April and a 0.1 percent decline in March. This was mainly due to the higher growth posted in housing, water, electricity, gas and other fuels index at 1.4 percent and -0.7 percent. From a growth of 0.1 percent, bigger increments were also observed in the indices of alcoholic beverages and tobacco at 0.2 percent; recreation and culture, 0.3 percent; and restaurant and miscellaneous goods and services, 0.5 percent. Those for the rest of the commodity groups were either zero or remained at their last month’s rate with the indices for food and non-alcoholic and clothing and footwear slowing to 0.1 percent from 0.4 percent; and health, 0.1 percent from 0.2 percent.
Similarly, consumer prices in AONCR kicked up by 0.4 percent in April. Higher monthly growths were noted in food and non-alcoholic beverages index at 0.6 percent and in housing, water, electricity, gas and other fuels index, 0.5 percent. Meanwhile, the monthly rates in the indices of alcoholic beverages and tobacco and furnishing, household equipment and routine maintenance of the house correspondingly eased to 0.2 percent and 0.1 percent. The rest of the commodity groups either retained their previous month’s rate or had zero growth.
Ten regions had higher monthly price add-ons with CALABARZON recording the highest rate at 0.7 percent.
Among the three big areas of the country, price hikes in consumer items were generally faster in Luzon compared to Visayas and Mindanao areas.
By Commodity Group, Month-on-Month
-
The upward price movement in the heavily-weighted food and non-alcoholic beverages index at 0.5 percent and 0.1 percent in March primarily pushed up the general level of the country’s consumer prices by 0.4 percent. Moreover, higher upticks were noted in housing, water, electricity, gas and other fuels index at 0.8 percent from -0.8 percent and in restaurant and miscellaneous goods and services index, 0.3 percent. The other commodity groups either slowed down or retained their last month’s rate with zero growths posted in the indices for transport; communication; and education.
-
Low supplies of pork in the markets raised its prices during the month. It resulted to a 0.9 percent growth in the meat index in the three areas. Increments in the prices of chicken, beef and processed meat products were also noticed in many regions.
-
The food products not elsewhere classified index in the Philippines leaped by 2.4 percent in April and 0.4 percent in March; NCR, 5.0 percent and 1.2 percent; and AONCR, 1.9 percent and 0.2 percent. This was attributed to upward price adjustments in ginger due to its limited supplies in the markets. Price mark-ups in some condiments and seasonings in many regions also contributed to the uptrend.
-
A faster rate of increment was seen in the fruit index in AONCR at 1.1 percent in April and 0.1 percent in March brought about by higher prices in some fruits which were out of season. In NCR, these increases were tempered by price reductions in mango and young coconut. Hence, movement in the fruit index in the area eased to 0.5 percent. The group’s index in the Philippines advanced 1.0 percent.
-
The index for milk, cheese and egg in AONCR grew by 0.3 percent and in the Philippines and in NCR, 0.4 percent as prices of cheese remained higher in many regions. Add-ons in the prices of milk were also noticed in selected regions.
-
The fine weather that generally prevailed during the month was favourable for deep sea fishing. This led to bigger volume of catch of fresh fish which pushed down their prices in the markets. Thus, the fish index in NCR dropped by 0.6 percent. Despite price declines in fresh fish in many regions, the group’s index in AONCR still picked up 0.4 percent as prices of some sea foods and processed fish generally went up during the month. At the national level, the fish index inched up 0.2 percent.
-
Prices of rice were still on the uptrend in AONCR as its index had a 0.8 percent growth during the month. This was however, slower than the previous month’s rate of 1.0 percent as monthly growth in the rice index in eight regions decelerated. The highest rate of 1.3 percent was noticed in Ilocos while the lowest of 0.1 percent was in Eastern Visayas. In NCR, the group’s index fell by 2.2 percent due to bigger volume of supplies of low-priced NFA rice in the markets. At the national level, the rice index moved up by 0.4 percent, lower than the 1.1 percent increase last month.
-
Higher charges in electricity rates primarily effected the 0.8 percent growth in the index for housing, water, electricity, gas and other fuels in the Philippines; 1.4 percent in NCR; and 0.5 percent in AONCR. Price hikes in selected construction materials in AONCR were also observed during the month.
-
The index for restaurant and miscellaneous goods and services in the Philippines rose 0.3 percent; NCR, 0.5 percent; and AONCR, 0.2 percent. This can be attributed to price gains in meals eaten outside the home and in some items for personal care and effects in selected regions.
-
With price increments in clothing and footwear items, the group’s index in AONCR and in the Philippines recorded growths of 0.2 percent and in NCR, 0.1 percent.
-
NOTES:
- The second phase survey report from Sulu was not received as of May 5, 2014.
- CPIs and inflation rates by province and selected city are also available upon request at NSO, Industry and Trade Statistics Department, Economic Indices and Indicators Division (Telephone Numbers: 716-39-35 and 715-33-47).
(Sgd.) LISA GRACE S. BERSALES, Ph.D.
National Statistician