
AUGUST AND JULY 2012
| Year-on-Year Inflation Rates, All Items | |||
|---|---|---|---|
| August 2012 | July 2012 | Year-to-date | |
| Philippines | |||
| Headline | 3.8 | 3.2 | 3.2 |
| Core | 4.3 | 4.1 | 3.7 |
| NCR | |||
| Headline | 4.5 | 3.1 | 2.9 |
| AONCR | |||
| Headline | 3.6 | 3.2 | 3.2 |
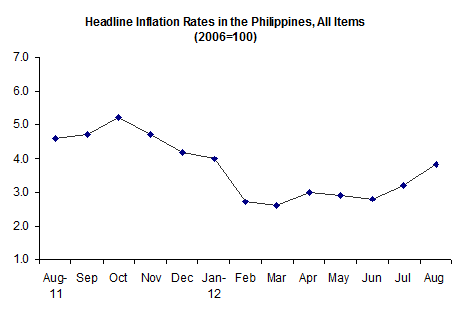
The year-on-year inflation rate at the national level advanced to 3.8 percent in August from 3.2 percent in July. The uptrend was due to higher annual increases posted in the five commodity groups namely: food and non-alcoholic beverages; clothing and footwear; housing, water, electricity, gas and other fuels; furnishing, household equipment and routine maintenance of the house; and transport. Inflation a year ago was 4.6 percent.
Excluding selected food and energy items, core inflation went up to 4.3 percent in August from 4.1 percent in July.
Inflation in the National Capital Region (NCR) jumped to 4.5 percent in August from 3.1 percent in July. This was due to higher annual increases in all the commodity groups except in the indices of health, education and restaurant and miscellaneous goods and services.
In Areas Outside NCR (AONCR), annual inflation picked up to 3.6 percent in August from 3.2 percent in July. Higher annual mark-ups were posted in the indices of food and non-alcoholic beverages; housing, water, electricity, gas and other fuels; and transport.
| Year-on-Year Inflation Rates in the Philippines, All Items January 2007 - August 2012 | ||||||
|---|---|---|---|---|---|---|
| Month | Year | |||||
| 2007 | 2008 | 2009 | 2010 | 2011 | 2012 | |
| January | 3.8 | 4.6 | 7.1r | 3.9 | 4.0r | 4.0r |
| February | 2.9 | 5.1 | 7.2 | 3.9 | 4.7 | 2.7 |
| March | 2.6 | 5.8r | 6.7r | 3.9r | 4.9 | 2.6 |
| April | 2.6 | 7.3 | 5.6 | 4.0 | 4.7r | 3.0 |
| May | 2.7r | 8.2r | 4.3r | 3.9r | 4.9r | 2.9 |
| June | 2.6r | 9.4 | 3.2r | 3.6r | 5.2 | 2.8 |
| July | 2.9 | 10.2 | 2.1 | 3.8r | 4.9r | 3.2 |
| August | 2.7 | 10.5 | 1.7 | 4.1r | 4.6r | 3.8 |
| September | 2.9 | 10.1 | 2.3r | 3.8r | 4.7r | |
| October | 2.9 | 9.7 | 2.8 | 3.3 | 5.2 | |
| November | 3.1 | 9.1r | 3.5r | 3.7 | 4.7r | |
| December | 3.7r | 7.8r | 4.4r | 3.6r | 4.2r | |
| Average | 2.9 | 8.3 | 4.1 | 3.9r | 4.6r | |
| Month-on-Month Inflation Rates, All Items | ||
|---|---|---|
| Aug 2012 | Jul 2012 | |
| Philippines | 0.8 | 0.3 |
| NCR | 1.2 | 0.6 |
| AONCR | 0.6 | 0.2 |
-
On a monthly basis, prices of consumer items in the Philippines rose 0.8 percent in August from 0.3 percent in July. It primarily resulted from the price increments of the heavily-weighted food items particularly rice, meat, fish, fruits, vegetables and sugar. Upward price adjustments in LPG, kerosene, gasoline and diesel were also noted in all the regions.
CONSUMER PRICE INDEX
(2006=100)
AUGUST 2012
By Region, Year-on-Year
-
Annual inflation in NCR accelerated to 4.5 percent in August from 3.1 percent in July.
-
Likewise, annual inflation in AONCR rose 3.6 percent in August from 3.2 percent in July as higher annual rates were posted in all the regions except in Davao and ARMM. The biggest uptick of 1.1 percentage points was in CAR (4.9% from 3.8%). The highest annual rate of 6.6 percent remained in Central Visayas while the lowest annual inflation of 1.6 percent was in Davao region.
By Commodity Group, Year-on-Year
-
Year-on-year inflation in the Philippines was higher in five commodity groups. Slower annual hikes were however posted in alcoholic beverages and tobacco, health, and restaurant and miscellaneous goods and services indices.
The annual increase of the food alone index at the national level climbed to 3.3 percent in August from 2.2 percent in July.
The annual change in the rice index grew to 1.0 percent in August from 0.5 percent in July; meat index, 1.3 percent from 1.0 percent; fish index, 7.3 percent from 6.7 percent; fruits index, 7.7 percent from 7.5 percent; vegetables index, 7.4 percent from zero percent; and food products not elsewhere classified index, 1.7 percent from 1.4 percent. On the other hand, the annual add-on in the corn index eased to 3.3 percent from 5.6 percent. The annual adjustments in the other food groups were either negative or remained at their previous month’s rate.
-
In NCR, all the commodity groups have higher annual additions except in the indices of health, education, and restaurant and miscellaneous goods and services.
-
The food alone index in NCR soared to 5.0 percent in August from 1.7 percent in July.
-
A double-digit annual hike was seen in the vegetables index at 26.4 percent in August from 2.0 percent in July. A higher annual uptick was also registered in the rice index at 1.9 percent from -1.3 percent; meat index, 2.0 percent from 1.3 percent; fish index, 7.5 percent from 5.4 percent; milk, cheese and egg index, 4.6 percent from 4.5 percent; fruits index, 5.8 percent from 4.4 percent; and food products not elsewhere classified index, 0.9 percent from -0.8 percent.
-
-
In AONCR, a faster annual increment was observed in food and non-alcoholic beverages index at 3.0 percent in August from 2.5 percent in July; housing, water, electricity, gas and other fuels index, 5.7 percent from 5.3 percent; and transport index, 1.6 percent from 1.2 percent. Slowdowns in the annual increases were noticed in the other commodity groups with the annual adjustment in clothing and footwear index remaining at its last month’s rate of 4.5 percent and in education index, 4.8 percent. The communication index had still a zero annual growth.
-
The annual inflation of the food alone index in AONCR rose 2.9 percent in August from 2.4 percent in July.
-
A 0.9 percent annual uptick was seen in the rice index in August from 0.7 percent in July as eight regions have higher annual add-ons. The biggest acceleration of 1.4 percentage points was in SOCCSKSARGEN (3.8% from 2.4%).
-
The meat index recorded a higher annual growth of 1.0 percent in August from 0.9 percent in July; fish index, 7.3 percent from 6.9 percent; and vegetables index, 3.9 percent from -0.4 percent.
-
The annual hike in the corn index decelerated to 3.3 percent from 5.5 percent; fruits index, 8.2 percent from 8.3 percent; and food products not elsewhere classified index, 1.9 percent from 2.0 percent. The indices of the other food groups had either negative annual change or moved at their last month’s rate.
-
By Region, Month-on-Month
Prices in NCR leaped by 1.2 percent in August from 0.6 percent in July. The monthly growth in the heavily-weighted food and non-alcoholic beverages index shoot up by 2.3 percent in August from 0.6 percent in July; housing, water, electricity, gas and other fuels index, 1.2 percent from 0.8 percent; furnishing, household equipment and routine maintenance of the house index, 1.7 percent from 0.9 percent; and transport index, 0.8 percent from -0.1 percent. The rest of the commodity groups had lower monthly increments with the indices for communication, education and restaurant and miscellaneous goods and services having a zero growth.
Following the same trend in NCR, prices of consumer items in AONCR inched up 0.6 percent in August from 0.2 percent in July. The monthly rate in food and non-alcoholic beverages index rose 0.7 percent in August from 0.4 percent in July; housing, water, electricity, gas and other fuels index, 0.6 percent from 0.4 percent; and transport index, 0.6 percent from -0.5 percent.
Higher month-on-month inflation rates were recorded in eleven regions with the highest rate at 0.9 percent noted in CAR.
Price upticks in Luzon were faster compared to those in Visayas and Mindanao.
By Commodity Group, Month-on-Month
-
Mark-ups in the prices of consumer items in the country was at 0.8 percent in August from 0.3 percent in July. It resulted primarily from the higher monthly gain in food and non-alcoholic beverages index at 1.0 percent from 0.4 percent; housing, water, electricity, gas and other fuels index, 0.8 percent from 0.6 percent; and transport index, 0.6 percent from -0.4 percent. Monthly adjustments for the other commodity groups were either slower or remained at their July rates. A zero growth was noticed in the indices of communication, education and restaurant and miscellaneous goods and services during the month.
-
The heavy rains brought by typhoon “Gener” during the last week of July in major vegetable producing areas resulted to low supply of vegetables in the markets. The devastating effects of the monsoon rains, floods and typhoons during the month in production areas in Central and Northern Luzon provinces also contributed to the reduced supplies of vegetables in the markets. All these conditions effected a double-digit increase of 21.0 percent in the vegetables index in NCR from its last month’s rate of 2.6 percent. Likewise, areas in AONCR affected by these weather disturbances had higher monthly increments in the prices of vegetables. Thus, the group’s index grew by 3.7 percent from 1.3 percent. At the national level, the vegetables index jumped 6.5 percent from 1.5 percent.
-
The stormy weather conditions experienced during the month which restricted fishing activities lowered supplies of fish species in the markets. This factor raised the fish index in the three areas: Philippines, 1.5 percent from 0.1 percent; NCR, 2.4 percent from 0.4 percent; and AONCR, 1.4 percent from 0.1 percent.
-
The positive growths recorded in the rice index in most of the regions resulted to a 0.4 percent uptick in the group’s index for AONCR. These were however slower than the 0.5 percent gain last month. In NCR, the rice index had a 1.3 percent growth from 0.1 percent as prices of NFA rice were priced higher during the month. The movement of the rice index in the country was at its last month’s rate of 0.5 percent.
-
The fruits index in the Philippines climbed 1.2 percent from 0.5 percent; NCR, 1.8 percent from -0.2 percent; and AONCR, 1.0 percent from 0.7 percent. This was due to the continuous price hikes in mango. Upward price adjustments in other fresh fruits such as banana, pineapple and papaya were also noted during the month.
-
The increasing prices of sugar pushed up the index for sugar, jam, honey, chocolate and confectionery at the national level by 1.4 percent; NCR, 2.2 percent; and AONCR, 1.3 percent. These were however slower than their respective last month’s rates of 3.1 percent, 2.4 percent and 3.2 percent.
-
With the increments in the prices of fresh meat such as chicken, pork and beef in selected regions, the meat index at in the three areas rose 0.2 percent. Price gains in processed and canned meat were also registered in some regions.
-
The downward price trend in cooking oil in many regions resulted to the negative rates still posted in the oils and fats index in the three areas: Philippines, -0.7 percent; NCR, -2.4 percent; and AONCR, -0.2 percent.
-
-
The continuous escalation in the prices of LPG and kerosene in many regions along with the higher charges on electricity rates in NCR and in selected regions pushed the index of housing, water, electricity, gas, and other fuels at the national level by 0.8 percent; NCR, 1.2 percent; and AONCR, 0.6 percent.
-
The transport index in the Philippines and AONCR went up 0.6 percent and NCR, 0.8 percent. This can be attributed to the series of nationwide upward price adjustments in gasoline and diesel.
-
Increased salary of household help in NCR and in some regions were noted during the month. Price hikes in selected appliances were also recorded in some regions. Hence, the index of furnishing, household equipment and routine maintenance of house in NCR grew 1.7 percent and AONCR. 0.1 percent. At the national level, the group’s index posted a 0.5 percent growth.
NOTE:
-
The second phase survey report for Cagayan was not received as of September 4, 2012.
-
CPIs and inflation rates by province and selected city are also available upon request at NSO, Industry and Trade Statistics Department, Economic Indices and Indicators Division (Telephone Numbers: 716-39-35 and 715-33-47).
| (Sgd.) CARMELITA N. ERICTA Administrator |